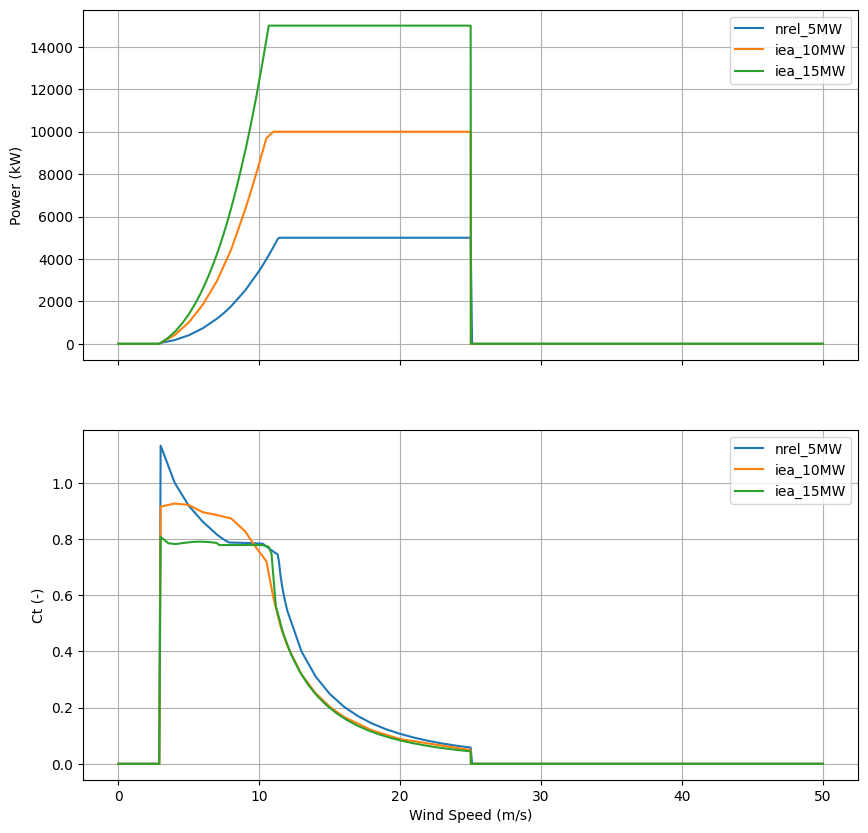
"""Example: Check turbine power curves
For each turbine in the turbine library, make a small figure showing that its power
curve and power loss to yaw are reasonable and reasonably smooth
"""
import matplotlib.pyplot as plt
import numpy as np
from floris import FlorisModel
ws_array = np.arange(0.1, 30, 0.2)
wd_array = 270.0 * np.ones_like(ws_array)
turbulence_intensities = 0.06 * np.ones_like(ws_array)
yaw_angles = np.linspace(-30, 30, 60)
wind_speed_to_test_yaw = 11
# Grab the gch model
fmodel = FlorisModel("../inputs/gch.yaml")
# Make one turbine simulation
fmodel.set(layout_x=[0], layout_y=[0])
# Apply wind directions and wind speeds
fmodel.set(
wind_speeds=ws_array, wind_directions=wd_array, turbulence_intensities=turbulence_intensities
)
# Get a list of available turbine models provided through FLORIS, and remove
# multi-dimensional power/thrust coefficient turbine definitions as they require different handling
turbines = [
t.stem
for t in fmodel.core.farm.internal_turbine_library.iterdir()
if t.suffix == ".yaml" and ("multi_dim" not in t.stem)
]
# Declare a set of figures for comparing cp and ct across models
fig_pow_ct, axarr_pow_ct = plt.subplots(2, 1, sharex=True, figsize=(10, 10))
# For each turbine model available plot the basic info
for t in turbines:
# Set t as the turbine
fmodel.set(turbine_type=[t])
fmodel.reset_operation() # Remove any previously applied yaw angles
# Since we are changing the turbine type, make a matching change to the reference wind height
fmodel.assign_hub_height_to_ref_height()
# Plot power and ct onto the fig_pow_ct plot
axarr_pow_ct[0].plot(
fmodel.core.farm.turbine_map[0].power_thrust_table["wind_speed"],
fmodel.core.farm.turbine_map[0].power_thrust_table["power"],
label=t,
)
axarr_pow_ct[0].grid(True)
axarr_pow_ct[0].legend()
axarr_pow_ct[0].set_ylabel("Power (kW)")
axarr_pow_ct[1].plot(
fmodel.core.farm.turbine_map[0].power_thrust_table["wind_speed"],
fmodel.core.farm.turbine_map[0].power_thrust_table["thrust_coefficient"],
label=t,
)
axarr_pow_ct[1].grid(True)
axarr_pow_ct[1].legend()
axarr_pow_ct[1].set_ylabel("Ct (-)")
axarr_pow_ct[1].set_xlabel("Wind Speed (m/s)")
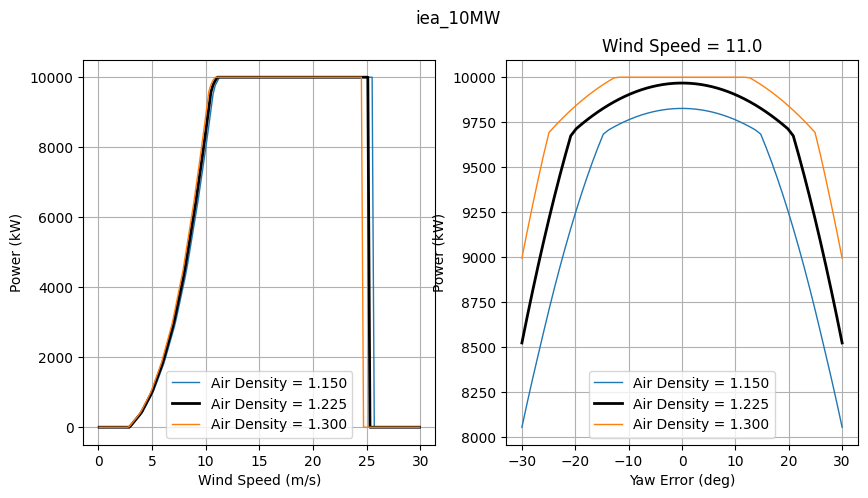
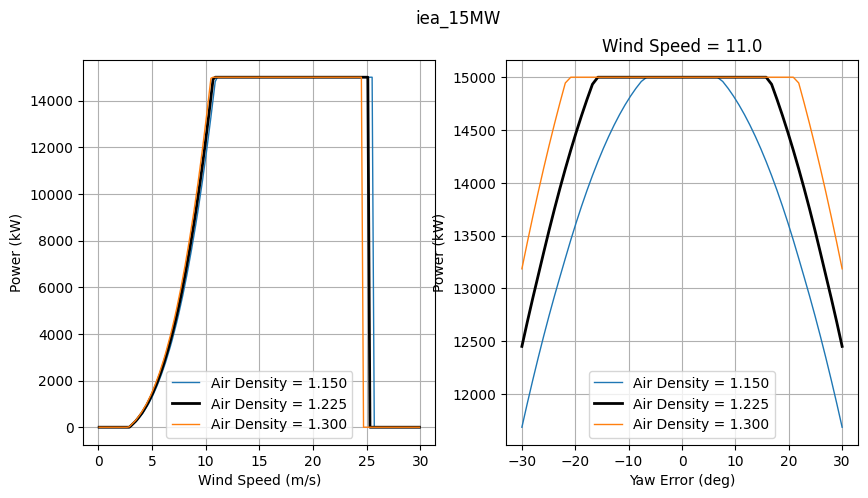
# Create a figure
fig, axarr = plt.subplots(1, 2, figsize=(10, 5))
# Try a few density
for density in [1.15, 1.225, 1.3]:
fmodel.set(air_density=density)
# POWER CURVE
ax = axarr[0]
fmodel.set(
wind_speeds=ws_array,
wind_directions=wd_array,
turbulence_intensities=turbulence_intensities,
)
fmodel.reset_operation() # Remove any previously applied yaw angles
fmodel.run()
turbine_powers = fmodel.get_turbine_powers().flatten() / 1e3
if density == 1.225:
ax.plot(ws_array, turbine_powers, label="Air Density = %.3f" % density, lw=2, color="k")
else:
ax.plot(ws_array, turbine_powers, label="Air Density = %.3f" % density, lw=1)
ax.grid(True)
ax.legend()
ax.set_xlabel("Wind Speed (m/s)")
ax.set_ylabel("Power (kW)")
# Power loss to yaw, try a range of yaw angles
ax = axarr[1]
fmodel.set(
wind_speeds=[wind_speed_to_test_yaw],
wind_directions=[270.0],
turbulence_intensities=[0.06],
)
yaw_result = []
for yaw in yaw_angles:
fmodel.set(yaw_angles=np.array([[yaw]]))
fmodel.run()
turbine_powers = fmodel.get_turbine_powers().flatten() / 1e3
yaw_result.append(turbine_powers[0])
if density == 1.225:
ax.plot(yaw_angles, yaw_result, label="Air Density = %.3f" % density, lw=2, color="k")
else:
ax.plot(yaw_angles, yaw_result, label="Air Density = %.3f" % density, lw=1)
# ax.plot(yaw_angles,yaw_result,label='Air Density = %.3f' % density)
ax.grid(True)
ax.legend()
ax.set_xlabel("Yaw Error (deg)")
ax.set_ylabel("Power (kW)")
ax.set_title("Wind Speed = %.1f" % wind_speed_to_test_yaw)
# Give a suptitle
fig.suptitle(t)
plt.show()
import warnings
warnings.filterwarnings('ignore')