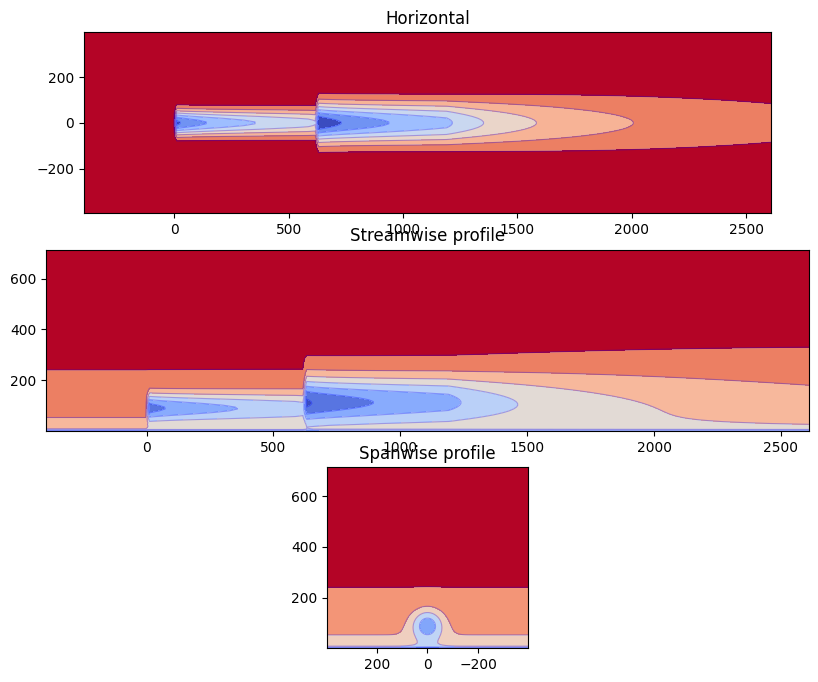
"""Example: Multiple turbine types

This example uses an input file where multiple turbine types are defined.
The first two turbines are the NREL 5MW, and the third turbine is the IEA 10MW.
"""


import matplotlib.pyplot as plt

import floris.flow_visualization as flowviz
from floris import FlorisModel


# Initialize FLORIS with the given input file.
# For basic usage, FlorisModel provides a simplified and expressive
# entry point to the simulation routines.
fmodel = FlorisModel("../inputs/gch_multiple_turbine_types.yaml")

# Using the FlorisModel functions for generating plots, run FLORIS
# and extract 2D planes of data.
horizontal_plane = fmodel.calculate_horizontal_plane(x_resolution=200, y_resolution=100, height=90)
y_plane = fmodel.calculate_y_plane(x_resolution=200, z_resolution=100, crossstream_dist=0.0)
cross_plane = fmodel.calculate_cross_plane(
    y_resolution=100, z_resolution=100, downstream_dist=500.0
)

# Create the plots
fig, ax_list = plt.subplots(3, 1, figsize=(10, 8))
ax_list = ax_list.flatten()
flowviz.visualize_cut_plane(horizontal_plane, ax=ax_list[0], title="Horizontal")
flowviz.visualize_cut_plane(y_plane, ax=ax_list[1], title="Streamwise profile")
flowviz.visualize_cut_plane(cross_plane, ax=ax_list[2], title="Spanwise profile")

plt.show()
import warnings
warnings.filterwarnings('ignore')