"""Example 9: Compare farm power with neighboring farm
This example demonstrates how to use turbine_weights to define a set of turbines belonging
to a neighboring farm which impacts the power production of the farm under consideration
via wake losses, but whose own power production is not considered in farm power / aep production
"""
import matplotlib.pyplot as plt
import numpy as np
from floris import FlorisModel
# Instantiate FLORIS using either the GCH or CC model
fmodel = FlorisModel("inputs/gch.yaml") # GCH model matched to the default "legacy_gauss" of V2
# Define a 4 turbine farm turbine farm
D = 126.0
layout_x = np.array([0, D * 6, 0, D * 6])
layout_y = [0, 0, D * 3, D * 3]
fmodel.set(layout_x=layout_x, layout_y=layout_y)
# Define a simple inflow with just 1 wind speed
wd_array = np.arange(0, 360, 4.0)
ws_array = 8.0 * np.ones_like(wd_array)
turbulence_intensities = 0.06 * np.ones_like(wd_array)
fmodel.set(
wind_directions=wd_array, wind_speeds=ws_array, turbulence_intensities=turbulence_intensities
)
# Calculate
fmodel.run()
# Collect the farm power
farm_power_base = fmodel.get_farm_power() / 1e3 # In kW
# Add a neighbor to the east
layout_x = np.array([0, D * 6, 0, D * 6, D * 12, D * 15, D * 12, D * 15])
layout_y = np.array([0, 0, D * 3, D * 3, 0, 0, D * 3, D * 3])
fmodel.set(layout_x=layout_x, layout_y=layout_y)
# Define the weights to exclude the neighboring farm from calculations of power
turbine_weights = np.zeros(len(layout_x), dtype=int)
turbine_weights[0:4] = 1.0
# Calculate
fmodel.run()
# Collect the farm power with the neighbor
farm_power_neighbor = fmodel.get_farm_power(turbine_weights=turbine_weights) / 1e3 # In kW
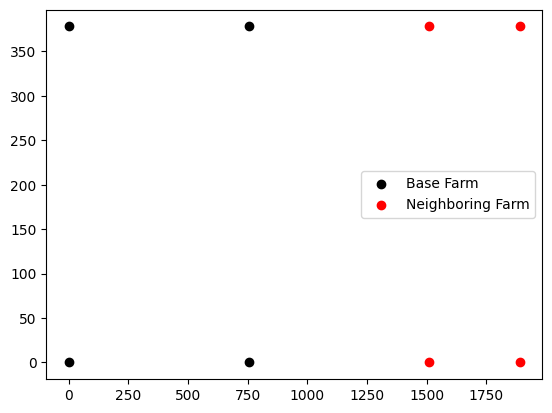
# Show the farms
fig, ax = plt.subplots()
ax.scatter(
layout_x[turbine_weights == 1], layout_y[turbine_weights == 1], color="k", label="Base Farm"
)
ax.scatter(
layout_x[turbine_weights == 0],
layout_y[turbine_weights == 0],
color="r",
label="Neighboring Farm",
)
ax.legend()
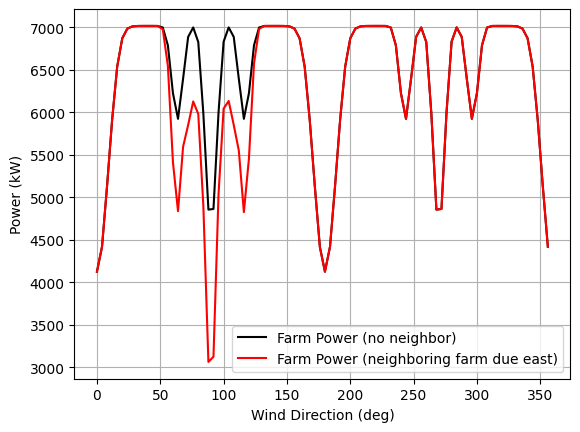
# Plot the power difference
fig, ax = plt.subplots()
ax.plot(wd_array, farm_power_base, color="k", label="Farm Power (no neighbor)")
ax.plot(wd_array, farm_power_neighbor, color="r", label="Farm Power (neighboring farm due east)")
ax.grid(True)
ax.legend()
ax.set_xlabel("Wind Direction (deg)")
ax.set_ylabel("Power (kW)")
plt.show()
import warnings
warnings.filterwarnings('ignore')