Example: Extract wind speed at points#
"""Example: Extract wind speed at points
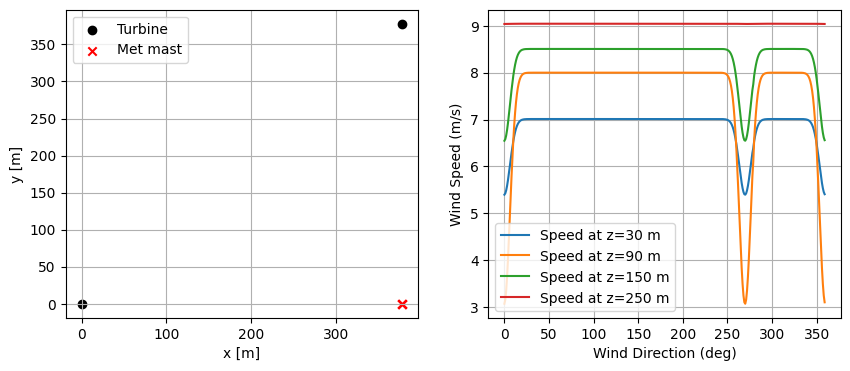
This example demonstrates the use of the sample_flow_at_points method of
FlorisModel. sample_flow_at_points extracts the wind speed
information at user-specified locations in the flow.
Specifically, this example returns the wind speed at a single x, y
location and four different heights over a sweep of wind directions.
This mimics the wind speed measurements of a met mast across all
wind directions (at a fixed free stream wind speed).
Try different values for met_mast_option to vary the location of the
met mast within the two-turbine farm.
"""
import matplotlib.pyplot as plt
import numpy as np
from floris import FlorisModel
# User options
# FLORIS model to use (legacy Turbopark not available)
floris_model = "gch" # Try "gch", "cc", "jensen", "emgauss", "turboparkgauss"
# Option to try different met mast locations
met_mast_option = 0 # Try 0, 1, 2, 3
# Instantiate FLORIS model
fmodel = FlorisModel("../inputs/" + floris_model + ".yaml")
# Set up a two-turbine farm
D = 126
fmodel.set(layout_x=[0, 3 * D], layout_y=[0, 3 * D])
fig, ax = plt.subplots(1, 2)
fig.set_size_inches(10, 4)
ax[0].scatter(fmodel.layout_x, fmodel.layout_y, color="black", label="Turbine")
# Set the wind direction to run 360 degrees
wd_array = np.arange(0, 360, 1)
ws_array = 8.0 * np.ones_like(wd_array)
ti_array = 0.06 * np.ones_like(wd_array)
fmodel.set(wind_directions=wd_array, wind_speeds=ws_array, turbulence_intensities=ti_array)
# Simulate a met mast in between the turbines
if met_mast_option == 0:
points_x = 4 * [3 * D]
points_y = 4 * [0]
elif met_mast_option == 1:
points_x = 4 * [200.0]
points_y = 4 * [200.0]
elif met_mast_option == 2:
points_x = 4 * [20.0]
points_y = 4 * [20.0]
elif met_mast_option == 3:
points_x = 4 * [305.0]
points_y = 4 * [158.0]
points_z = [30, 90, 150, 250]
# Collect the points
u_at_points = fmodel.sample_flow_at_points(points_x, points_y, points_z)
ax[0].scatter(points_x, points_y, color="red", marker="x", label="Met mast")
ax[0].grid()
ax[0].set_xlabel("x [m]")
ax[0].set_ylabel("y [m]")
ax[0].legend()
# Plot the velocities
for z_idx, z in enumerate(points_z):
ax[1].plot(wd_array, u_at_points[:, z_idx].flatten(), label=f"Speed at z={z} m")
ax[1].grid()
ax[1].legend()
ax[1].set_xlabel("Wind Direction (deg)")
ax[1].set_ylabel("Wind Speed (m/s)")
plt.show()
import warnings
warnings.filterwarnings('ignore')
/home/runner/work/floris/floris/floris/core/flow_field.py:169: UserWarning: 'where' used without 'out', expect unitialized memory in output. If this is intentional, use out=None.
  * np.power(