"""Example: Uncertain Model With Parallelization
This example demonstrates how to combined the parallelized model with the uncertain model
"""
import matplotlib.pyplot as plt
import numpy as np
from floris import (
FlorisModel,
TimeSeries,
UncertainFlorisModel,
)
from floris.par_floris_model import ParFlorisModel
if __name__ == "__main__":
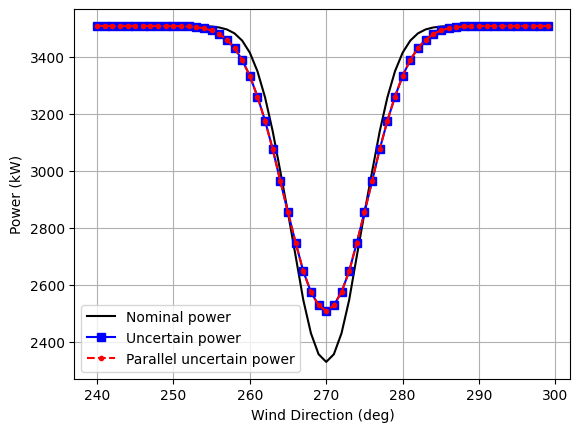
# Following the refactoring of ParFlorisModel, the UncertainFlorisModel can be
# parallelized by passing the ParFlorisModel as the model to be run. This example
# demonstrates the usage and shows that the result obtained from the UncertainFlorisModel
# with and without parallelization is the same. The results are compared to the nominal
# results.
# Instantiate a FlorisModel and ParallelFlorisModel using the GCH model
fmodel = FlorisModel("../inputs/gch.yaml")
pfmodel = ParFlorisModel("../inputs/gch.yaml")
# Use the above model to declare a serial and parallel UncertainFlorisModel
ufmodel = UncertainFlorisModel(fmodel)
pufmodel = UncertainFlorisModel(pfmodel)
# Define an inflow where wind direction is swept while
# wind speed and turbulence intensity are held constant
wind_directions = np.arange(240.0, 300.0, 1.0)
time_series = TimeSeries(
wind_directions=wind_directions,
wind_speeds=8.0,
turbulence_intensities=0.06,
)
# Define a two turbine farm and apply the inflow
D = 126.0
layout_x = np.array([0, D * 6])
layout_y = [0, 0]
# Apply to fmodel, ufmodel, and pufmodel
fmodel.set(
layout_x=layout_x,
layout_y=layout_y,
wind_data=time_series,
)
ufmodel.set(
layout_x=layout_x,
layout_y=layout_y,
wind_data=time_series,
)
pufmodel.set(
layout_x=layout_x,
layout_y=layout_y,
wind_data=time_series,
)
# Run the models
fmodel.run()
ufmodel.run()
pufmodel.run()
# Collect the farm power results from each model
farm_powers_nom = fmodel.get_farm_power() / 1e3
farm_powers_unc = ufmodel.get_farm_power() / 1e3
farm_powers_punc = pufmodel.get_farm_power() / 1e3
# Compare the results
fig, ax = plt.subplots()
ax.plot(wind_directions, farm_powers_nom.flatten(), 'k-', label="Nominal power")
ax.plot(wind_directions, farm_powers_unc.flatten(), 'bs-', label="Uncertain power")
ax.plot(wind_directions, farm_powers_punc.flatten(), 'r.--', label="Parallel uncertain power")
ax.grid(True)
ax.legend()
ax.set_xlabel("Wind Direction (deg)")
ax.set_ylabel("Power (kW)")
plt.show()
import warnings
warnings.filterwarnings('ignore')