"""Example: LTI and VOC Behavior with Changing Wind Direction and Power Setpoints

Demonstrate the behavior of the load turbulence intensity model and
variable operating cost (VOC) model with respect
to changing wind direction (which changes wake interactions) and
changing power setpoints (which changes wake strength).

"""

import matplotlib.pyplot as plt
import numpy as np

from floris import FlorisModel, TimeSeries
from floris.core.turbine.operation_models import (
    POWER_SETPOINT_DEFAULT,
    POWER_SETPOINT_DISABLED,
)
from floris.optimization.load_optimization.load_optimization import (
    compute_lti,
    compute_turbine_voc,
)


# Declare a floris model with default configuration
fmodel = FlorisModel(configuration="defaults")
fmodel.set_operation_model("simple-derating")

## Wind direction sweep
wind_directions = np.arange(0, 360, 1.0)

# Assume uniform load ambient turbulence intensities
ambient_lti = 0.1 * np.ones_like(wind_directions)

# Declare a time series representing the wind direction sweep
time_series = TimeSeries(
    wind_directions=wind_directions, wind_speeds=8.0, turbulence_intensities=0.06
)

# Set the turbine layout to be a simple two turbine layout using the
# time series object
D = fmodel.core.farm.rotor_diameters[0]
fmodel.set(layout_x=[0, D * 7], layout_y=[0.0, 0.0], wind_data=time_series)
fmodel.run()

# Compute the load turbulence intensity and VOC
load_ti = compute_lti(fmodel, ambient_lti)
voc = compute_turbine_voc(fmodel, A=2e-5, ambient_lti=ambient_lti)

# Plot the TI and VOC for each turbine
fig, ax = plt.subplots(2, 1, sharex=True)
for t in range(fmodel.n_turbines):
    ax[0].plot(wind_directions, load_ti[:, t], label=f"Turbine {t}")
    ax[1].plot(wind_directions, voc[:, t], label=f"Turbine {t}")
ax[0].set_ylabel("LTI [-]")
ax[1].set_ylabel("VOC [$]")
ax[1].set_xlabel("Wind Direction [deg]")
ax[1].legend(loc="lower right")
ax[0].grid()
ax[1].grid()
ax[0].set_title(
    "LTI and VOC vs Wind Direction\n"
    "X, Y Turbine Coordinates: T0: (0, 0), T1: (7D, 0)"
)

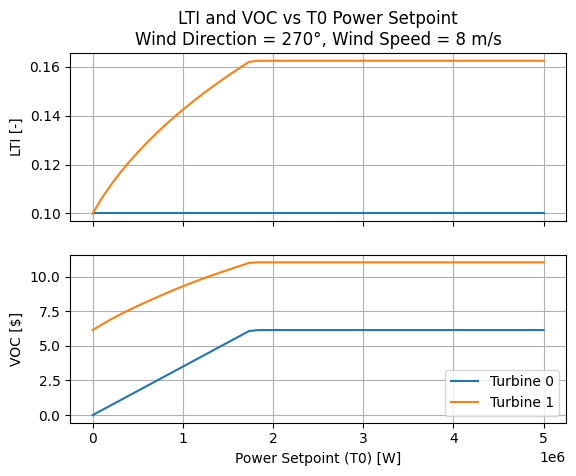
## Power setpoint sweep
N = 50
time_series = TimeSeries(
    wind_directions=np.ones(N) * 270.0, # Single wind direction
    wind_speeds=8.0,
    turbulence_intensities=0.06,
)
power_setpoints = np.column_stack([
    np.linspace(5e6, POWER_SETPOINT_DISABLED, N),
    np.ones(N)*POWER_SETPOINT_DEFAULT
])
ambient_lti = np.ones(N) * 0.1
fmodel.set(
    layout_x=[0, D * 7],
    layout_y=[0.0, 0.0],
    wind_data=time_series,
    power_setpoints=power_setpoints,
)
fmodel.run()

# Compute the load turbulence intensity and VOC
load_ti = compute_lti(fmodel, ambient_lti)
voc = compute_turbine_voc(fmodel, A=2e-5, ambient_lti=ambient_lti)

# Plot the TI and VOC for each turbine
fig, ax = plt.subplots(2, 1, sharex=True)
for t in range(fmodel.n_turbines):
    ax[0].plot(power_setpoints[:,0], load_ti[:, t], label=f"Turbine {t}")
    ax[1].plot(power_setpoints[:,0], voc[:, t], label=f"Turbine {t}")
ax[0].set_ylabel("LTI [-]")
ax[1].set_ylabel("VOC [$]")
ax[1].set_xlabel("Power Setpoint (T0) [W]")
ax[1].legend(loc="lower right")
ax[0].grid()
ax[1].grid()
ax[0].set_title(
    "LTI and VOC vs T0 Power Setpoint\n"
    "Wind Direction = 270\u00B0, Wind Speed = 8 m/s"
)

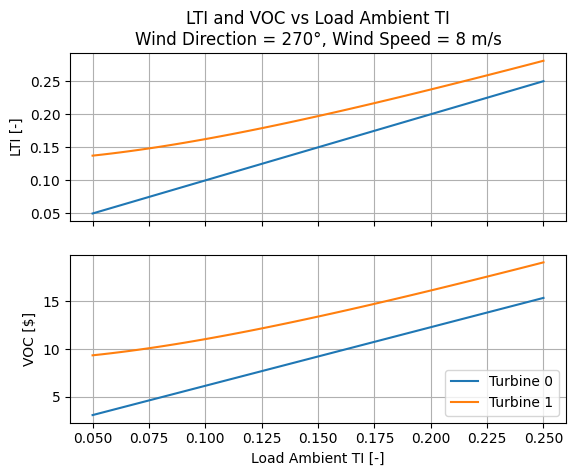
## Load ambient TI sweep
ambient_lti = np.linspace(0.05, 0.25, N)
power_setpoints = POWER_SETPOINT_DEFAULT * np.ones((N, 2))
fmodel.set(power_setpoints=power_setpoints)
fmodel.run()

# Compute the load turbulence intensity and VOC
load_ti = compute_lti(fmodel, ambient_lti)
voc = compute_turbine_voc(fmodel, A=2e-5, ambient_lti=ambient_lti)

# Plot the TI and VOC for each turbine
fig, ax = plt.subplots(2, 1, sharex=True)
for t in range(fmodel.n_turbines):
    ax[0].plot(ambient_lti, load_ti[:, t], label=f"Turbine {t}")
    ax[1].plot(ambient_lti, voc[:, t], label=f"Turbine {t}")
ax[0].set_ylabel("LTI [-]")
ax[1].set_ylabel("VOC [$]")
ax[1].set_xlabel("Load Ambient TI [-]")
ax[1].legend(loc="lower right")
ax[0].grid()
ax[1].grid()
ax[0].set_title(
    "LTI and VOC vs Load Ambient TI\n"
    "Wind Direction = 270\u00B0, Wind Speed = 8 m/s"
)

plt.show()
import warnings
warnings.filterwarnings('ignore')


