"""Example: Optimize yaw for multiple wind directions and multiple wind speeds.
This example demonstrates how to perform a yaw optimization for multiple wind directions
and multiple wind speeds using the WindRose object
First, we initialize our Floris Interface, and then generate a 3 turbine wind farm.
Next, we create the yaw optimization object `yaw_opt` and perform the optimization using
the SerialRefine method. Finally, we plot the results.
"""
import matplotlib.pyplot as plt
import numpy as np
from floris import FlorisModel, WindRose
from floris.optimization.yaw_optimization.yaw_optimizer_sr import YawOptimizationSR
# Load the default example floris object
fmodel = FlorisModel("../inputs/gch.yaml") # GCH model matched to the default "legacy_gauss" of V2
# fmodel = FlorisModel("inputs/cc.yaml") # New CumulativeCurl model
# Define a WindRose object with uniform TI and frequency table
wind_rose = WindRose(
wind_directions=np.arange(0.0, 360.0, 3.0),
wind_speeds=np.arange(2.0, 18.0, 1.0),
ti_table=0.06,
)
# Reinitialize as a 3-turbine farm with range of WDs and WSs
D = 126.0 # Rotor diameter for the NREL 5 MW
fmodel.set(
layout_x=[0.0, 5 * D, 10 * D],
layout_y=[0.0, 0.0, 0.0],
wind_data=wind_rose,
)
# Initialize optimizer object and run optimization using the Serial-Refine method
# Now, we enable the verify_convergence option. This function is useful to prevent
# yaw misalignment that increases the wind farm power production by a negligible
# amount. For example, at high wind speeds (e.g., 16 m/s), a turbine might yaw
# by a substantial amount to increase the power production by less than 1 W. This
# is typically the result of numerical imprecision of the power coefficient curve,
# which slightly differs for different above-rated wind speeds. The option
# verify_convergence therefore refines and validates the yaw angle choices
# but has no effect on the predicted power uplift from wake steering.
# Hence, it should mostly be used when actually synthesizing a practicable
# wind farm controller.
yaw_opt = YawOptimizationSR(fmodel)
df_opt = yaw_opt.optimize()
print("Optimization results:")
print(df_opt)
# Split out the turbine results
for t in range(3):
df_opt['t%d' % t] = df_opt.yaw_angles_opt.apply(lambda x: x[t])
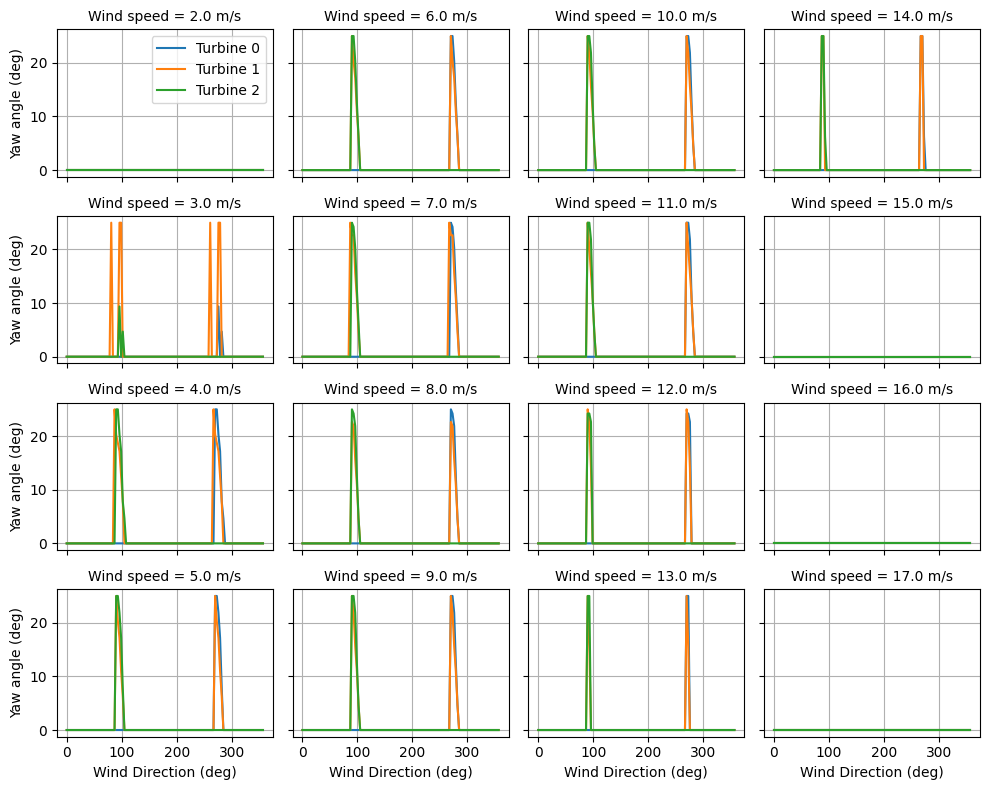
# Show the results: optimal yaw angles
fig, axarr = plt.subplots(
nrows=4,
ncols=4,
sharex=True,
sharey=True,
figsize=(10, 8)
)
jj = 0
for ii, ws in enumerate(np.unique(fmodel.wind_speeds)):
xi = np.remainder(ii, 4)
if ((ii > 0) & (xi == 0)):
jj += 1
ax = axarr[np.remainder(ii, 4)][jj]
ids = (df_opt.wind_speed == ws)
wd = df_opt.loc[ids, "wind_direction"]
for t in range(3):
yaw_opt = df_opt.loc[ids, "t{:d}".format(t)]
ax.plot(wd, yaw_opt, label='Turbine {:d}'.format(t))
ax.set_title("Wind speed = {:.1f} m/s".format(ws), size=10)
if ((ii == 0) & (jj == 0)):
ax.legend()
ax.grid(True)
if jj == 0:
ax.set_ylabel('Yaw angle (deg)', size=10)
if xi == 3:
axarr[xi][jj].set_xlabel('Wind Direction (deg)', size=10)
plt.tight_layout()
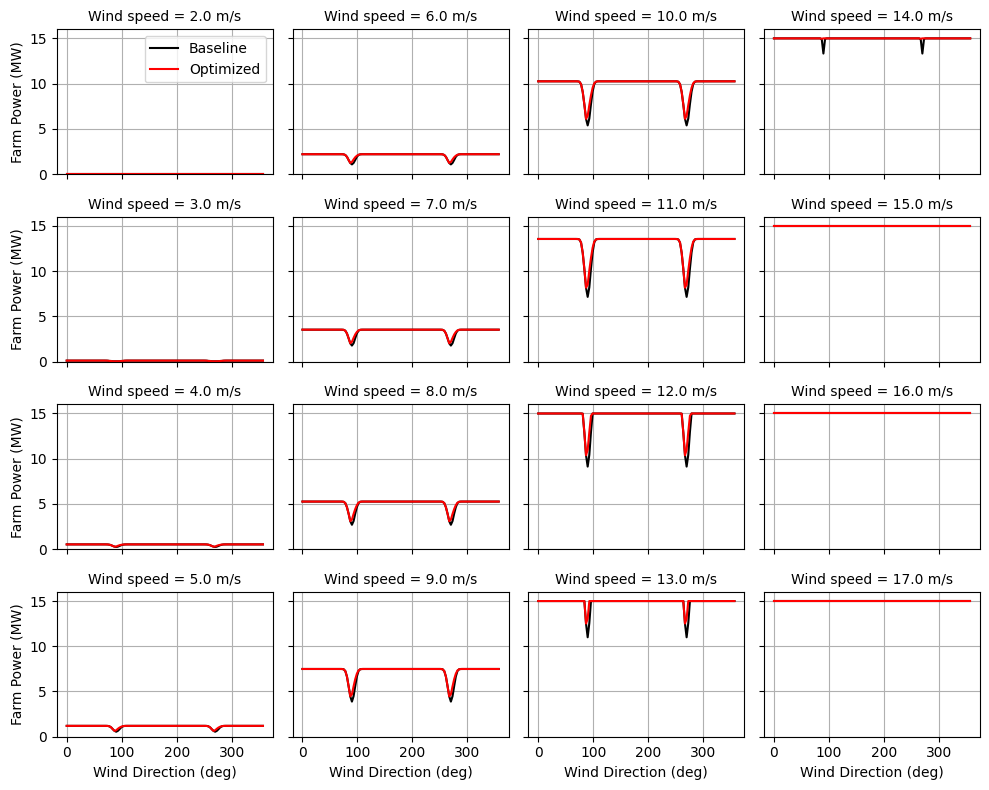
# Show the results: baseline and optimized farm power
fig, axarr = plt.subplots(
nrows=4,
ncols=4,
sharex=True,
sharey=True,
figsize=(10, 8)
)
jj = 0
for ii, ws in enumerate(np.unique(fmodel.wind_speeds)):
xi = np.remainder(ii, 4)
if ((ii > 0) & (xi == 0)):
jj += 1
ax = axarr[np.remainder(ii, 4)][jj]
ids = (df_opt.wind_speed == ws)
wd = df_opt.loc[ids, "wind_direction"]
power_baseline = df_opt.loc[ids, "farm_power_baseline"]
power_opt = df_opt.loc[ids, "farm_power_opt"]
ax.plot(wd, power_baseline / 1e6, color='k', label='Baseline')
ax.plot(wd, power_opt / 1e6, color='r', label='Optimized')
ax.set_title("Wind speed = {:.1f} m/s".format(ws), size=10)
ax.set_ylim([0.0, 16.0])
if ((ii == 0) & (jj == 0)):
ax.legend()
ax.grid(True)
if jj == 0:
ax.set_ylabel('Farm Power (MW)', size=10)
if xi == 3:
axarr[xi][jj].set_xlabel('Wind Direction (deg)', size=10)
plt.tight_layout()
plt.show()
import warnings
warnings.filterwarnings('ignore')