"""Example: Specify turbine power curve
This example demonstrates how to specify a turbine model based on a power
and thrust curve for the wind turbine, as well as possible physical parameters
(which default to the parameters of the NREL 5MW reference turbine).
Note that it is also possible to have a .yaml created, if the file_path
argument to build_turbine_dict is set.
"""
import matplotlib.pyplot as plt
import numpy as np
from floris import FlorisModel
from floris.turbine_library import build_cosine_loss_turbine_dict
# Generate an example turbine power and thrust curve for use in the FLORIS model
powers_orig = np.array([0, 30, 200, 500, 1000, 2000, 4000, 4000, 4000, 4000, 4000])
wind_speeds = np.array([0, 2, 4, 6, 8, 10, 12, 14, 16, 18, 20])
power_coeffs = powers_orig[1:] / (0.5 * 126.0**2 * np.pi / 4 * 1.225 * wind_speeds[1:] ** 3)
turbine_data_dict = {
"wind_speed": list(wind_speeds),
"power_coefficient": [0] + list(power_coeffs),
"thrust_coefficient": [0, 0.9, 0.9, 0.8, 0.7, 0.6, 0.5, 0.4, 0.3, 0.25, 0.2],
}
turbine_dict = build_cosine_loss_turbine_dict(
turbine_data_dict,
"example_turbine",
file_name=None,
generator_efficiency=1,
hub_height=90,
cosine_loss_exponent_yaw=1.88,
cosine_loss_exponent_tilt=1.88,
rotor_diameter=126,
TSR=8,
ref_air_density=1.225,
ref_tilt=5,
)
fmodel = FlorisModel("../inputs/gch.yaml")
wind_speeds = np.linspace(1, 15, 100)
wind_directions = 270 * np.ones_like(wind_speeds)
turbulence_intensities = 0.06 * np.ones_like(wind_speeds)
# Replace the turbine(s) in the FLORIS model with the created one
fmodel.set(
layout_x=[0],
layout_y=[0],
wind_directions=wind_directions,
wind_speeds=wind_speeds,
turbulence_intensities=turbulence_intensities,
turbine_type=[turbine_dict],
reference_wind_height=fmodel.reference_wind_height
)
fmodel.run()
powers = fmodel.get_farm_power()
specified_powers = (
np.array(turbine_data_dict["power_coefficient"])
* 0.5
* turbine_dict["power_thrust_table"]["ref_air_density"]
* turbine_dict["rotor_diameter"] ** 2
* np.pi
/ 4
* np.array(turbine_data_dict["wind_speed"]) ** 3
) / 1000
fig, ax = plt.subplots(1, 1, sharex=True)
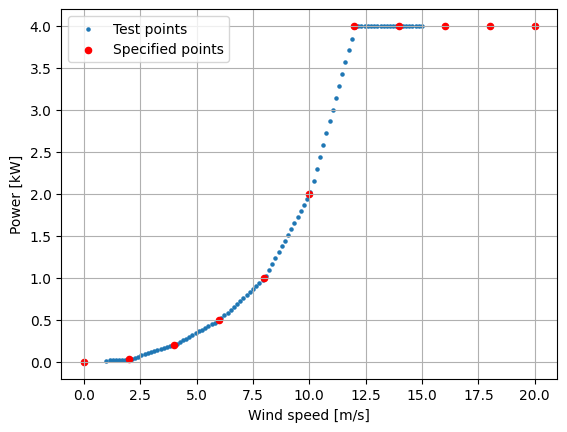
ax.scatter(wind_speeds, powers / 1000, color="C0", s=5, label="Test points")
ax.scatter(
turbine_data_dict["wind_speed"], specified_powers, color="red", s=20, label="Specified points"
)
ax.grid()
ax.set_xlabel("Wind speed [m/s]")
ax.set_ylabel("Power [kW]")
ax.legend()
plt.show()
import warnings
warnings.filterwarnings('ignore')