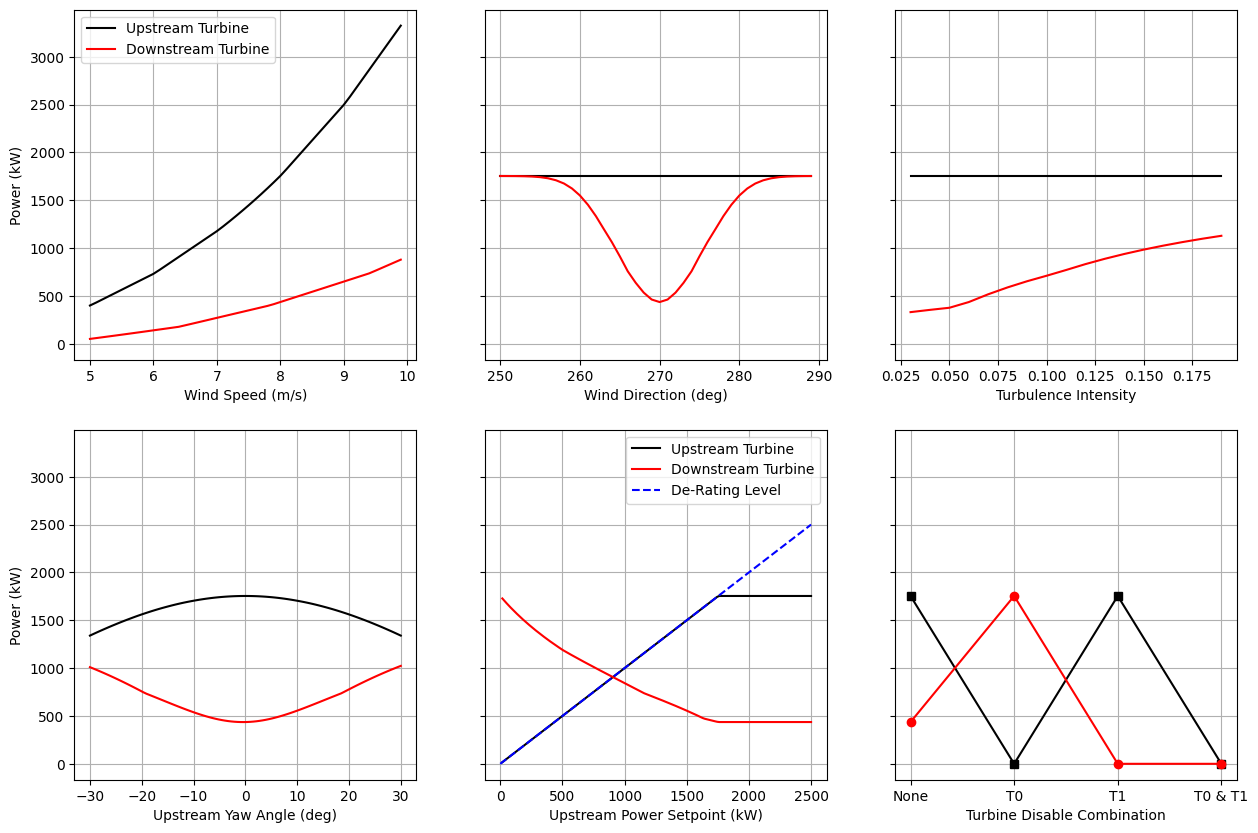
"""Example 7: Sweeping Variables

Demonstrate methods for sweeping across variables.  Wind directions, wind speeds,
turbulence intensities, as well as control inputs are passed to set() as arrays
and so can be swept and run in one call to run().

The example includes demonstrations of sweeping:

    1) Wind speeds
    2) Wind directions
    3) Turbulence intensities
    4) Yaw angles
    5) Power setpoints
    6) Disabling turbines

"""

import matplotlib.pyplot as plt
import numpy as np

from floris import (
    FlorisModel,
    TimeSeries,
)


fmodel = FlorisModel("inputs/gch.yaml")

# Set to a 2 turbine layout
fmodel.set(layout_x=[0.0, 126 * 5], layout_y=[0.0, 0.0])

# Start a figure for the results
fig, axarr = plt.subplots(2, 3, figsize=(15, 10), sharey=True)
axarr = axarr.flatten()

######################################################
# Sweep wind speeds
######################################################


# The TimeSeries object is the most convenient for sweeping
# wind speeds while keeping the wind direction and turbulence
# intensity constant
wind_speeds = np.arange(5, 10, 0.1)
fmodel.set(
    wind_data=TimeSeries(
        wind_speeds=wind_speeds, wind_directions=270.0, turbulence_intensities=0.06
    )
)
fmodel.run()
turbine_powers = fmodel.get_turbine_powers() / 1e3

# Plot the results
ax = axarr[0]
ax.plot(wind_speeds, turbine_powers[:, 0], label="Upstream Turbine", color="k")
ax.plot(wind_speeds, turbine_powers[:, 1], label="Downstream Turbine", color="r")
ax.set_ylabel("Power (kW)")
ax.set_xlabel("Wind Speed (m/s)")
ax.legend()

######################################################
# Sweep wind directions
######################################################


wind_directions = np.arange(250, 290, 1.0)
fmodel.set(
    wind_data=TimeSeries(
        wind_speeds=8.0, wind_directions=wind_directions, turbulence_intensities=0.06
    )
)
fmodel.run()
turbine_powers = fmodel.get_turbine_powers() / 1e3

# Plot the results
ax = axarr[1]
ax.plot(wind_directions, turbine_powers[:, 0], label="Upstream Turbine", color="k")
ax.plot(wind_directions, turbine_powers[:, 1], label="Downstream Turbine", color="r")
ax.set_xlabel("Wind Direction (deg)")

######################################################
# Sweep turbulence intensities
######################################################

turbulence_intensities = np.arange(0.03, 0.2, 0.01)
fmodel.set(
    wind_data=TimeSeries(
        wind_speeds=8.0, wind_directions=270.0, turbulence_intensities=turbulence_intensities
    )
)
fmodel.run()

turbine_powers = fmodel.get_turbine_powers() / 1e3

# Plot the results
ax = axarr[2]
ax.plot(turbulence_intensities, turbine_powers[:, 0], label="Upstream Turbine", color="k")
ax.plot(turbulence_intensities, turbine_powers[:, 1], label="Downstream Turbine", color="r")
ax.set_xlabel("Turbulence Intensity")

######################################################
# Sweep the upstream yaw angle
######################################################

# First set the conditions to uniform for N yaw_angles
n_yaw = 100
wind_directions = np.ones(n_yaw) * 270.0
fmodel.set(
    wind_data=TimeSeries(
        wind_speeds=8.0, wind_directions=wind_directions, turbulence_intensities=0.06
    )
)

yaw_angles_upstream = np.linspace(-30, 30, n_yaw)
yaw_angles = np.zeros((n_yaw, 2))
yaw_angles[:, 0] = yaw_angles_upstream

fmodel.set(yaw_angles=yaw_angles)
fmodel.run()
turbine_powers = fmodel.get_turbine_powers() / 1e3

# Plot the results
ax = axarr[3]
ax.plot(yaw_angles_upstream, turbine_powers[:, 0], label="Upstream Turbine", color="k")
ax.plot(yaw_angles_upstream, turbine_powers[:, 1], label="Downstream Turbine", color="r")
ax.set_xlabel("Upstream Yaw Angle (deg)")
ax.set_ylabel("Power (kW)")

######################################################
# Sweep the upstream power rating
######################################################

# Since we're changing control modes, need to reset the operation
fmodel.reset_operation()

# To the de-rating need to change the power_thrust_mode to mixed or simple de-rating
fmodel.set_operation_model("simple-derating")

# Sweep the de-rating levels
RATED_POWER = 5e6  # For NREL 5MW
n_derating_levels = 150
upstream_power_setpoint = np.linspace(0.0, RATED_POWER * 0.5, n_derating_levels)
power_setpoints = np.ones((n_derating_levels, 2)) * RATED_POWER
power_setpoints[:, 0] = upstream_power_setpoint

# Set the wind conditions to fixed
wind_directions = np.ones(n_derating_levels) * 270.0
fmodel.set(
    wind_data=TimeSeries(
        wind_speeds=8.0, wind_directions=wind_directions, turbulence_intensities=0.06
    )
)

# Set the de-rating levels
fmodel.set(power_setpoints=power_setpoints)
fmodel.run()

# Get the turbine powers
turbine_powers = fmodel.get_turbine_powers() / 1e3

# Plot the results
ax = axarr[4]
ax.plot(upstream_power_setpoint / 1e3, turbine_powers[:, 0], label="Upstream Turbine", color="k")
ax.plot(upstream_power_setpoint / 1e3, turbine_powers[:, 1], label="Downstream Turbine", color="r")
ax.plot(
    upstream_power_setpoint / 1e3,
    upstream_power_setpoint / 1e3,
    label="De-Rating Level",
    color="b",
    linestyle="--",
)
ax.set_xlabel("Upstream Power Setpoint (kW)")
ax.legend()

######################################################
# Sweep through disabling turbine combinations
######################################################

# Reset the control settings
fmodel.reset_operation()

# Make a list of possible turbine disable combinations
disable_combinations = np.array([[False, False], [True, False], [False, True], [True, True]])
n_combinations = disable_combinations.shape[0]

# Make a list of strings representing the combinations
disable_combination_strings = ["None", "T0", "T1", "T0 & T1"]

# Set the wind conditions to fixed
wind_directions = np.ones(n_combinations) * 270.0
fmodel.set(
    wind_data=TimeSeries(
        wind_speeds=8.0, wind_directions=wind_directions, turbulence_intensities=0.06
    )
)

# Assign the disable settings
fmodel.set(disable_turbines=disable_combinations)

# Run the model
fmodel.run()

# Get the turbine powers
turbine_powers = fmodel.get_turbine_powers() / 1e3

# Plot the results
ax = axarr[5]
ax.plot(disable_combination_strings, turbine_powers[:, 0], "ks-", label="Upstream Turbine")
ax.plot(disable_combination_strings, turbine_powers[:, 1], "ro-", label="Downstream Turbine")
ax.set_xlabel("Turbine Disable Combination")


for ax in axarr:
    ax.grid(True)


plt.show()
import warnings
warnings.filterwarnings('ignore')