"""Example: Floating vs fixed-bottom farm
This example demonstrates the impact of floating on turbine power and thrust
and wake behavior. A floating turbine in FLORIS is defined by including a
`floating_tilt_table` in the turbine input yaml which sets the steady tilt
angle of the turbine based on wind speed. This tilt angle is computed for each
turbine based on effective velocity. This tilt angle is then passed on
to the respective wake model.
The value of the parameter ref_tilt is the value of tilt at which the
ct/cp curves have been defined.
With `correct_cp_ct_for_tilt` True, the difference between the current
tilt as interpolated from the floating tilt table is used to scale the turbine
power and thrust.
In the example below, a 20-turbine, gridded wind farm is simulated using
the Empirical Gaussian wake model to show the effects of floating turbines on
both turbine power and wake development.
fmodel_fixed: Fixed bottom turbine (no tilt variation with wind speed)
fmodel_floating: Floating turbine (tilt varies with wind speed)
"""
import matplotlib.pyplot as plt
import numpy as np
import pandas as pd
from scipy.interpolate import NearestNDInterpolator
import floris.flow_visualization as flowviz
from floris import FlorisModel, WindRose
# Declare the Floris Interface for fixed bottom, provide layout
fmodel_fixed = FlorisModel("../inputs_floating/emgauss_fixed.yaml")
fmodel_floating = FlorisModel("../inputs_floating/emgauss_floating.yaml")
x, y = np.meshgrid(np.linspace(0, 4*630., 5), np.linspace(0, 3*630., 4))
x = x.flatten()
y = y.flatten()
for fmodel in [fmodel_fixed, fmodel_floating]:
fmodel.set(layout_x=x, layout_y=y)
# Compute a single wind speed and direction, power and wakes
for fmodel in [fmodel_fixed, fmodel_floating]:
fmodel.set(
layout_x=x,
layout_y=y,
wind_speeds=[10],
wind_directions=[270],
turbulence_intensities=[0.06],
)
fmodel.run()
powers_fixed = fmodel_fixed.get_turbine_powers()
powers_floating = fmodel_floating.get_turbine_powers()
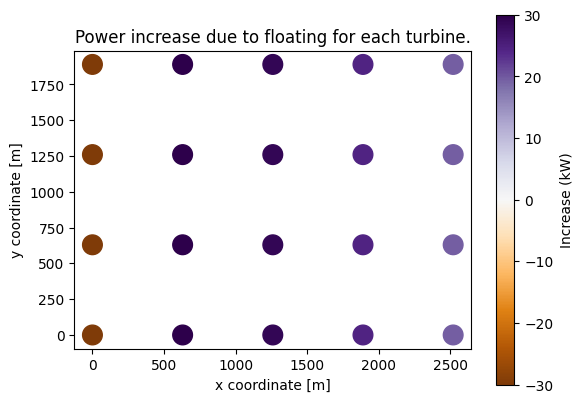
power_difference = powers_floating - powers_fixed
# Show the power differences
fig, ax = plt.subplots()
ax.set_aspect('equal', adjustable='box')
sc = ax.scatter(
x,
y,
c=power_difference.flatten()/1000,
cmap="PuOr",
vmin=-30,
vmax=30,
s=200,
)
ax.set_xlabel("x coordinate [m]")
ax.set_ylabel("y coordinate [m]")
ax.set_title("Power increase due to floating for each turbine.")
plt.colorbar(sc, label="Increase (kW)")
print("Power increase from floating over farm (10m/s, 270deg winds): {0:.2f} kW".\
format(power_difference.sum()/1000))
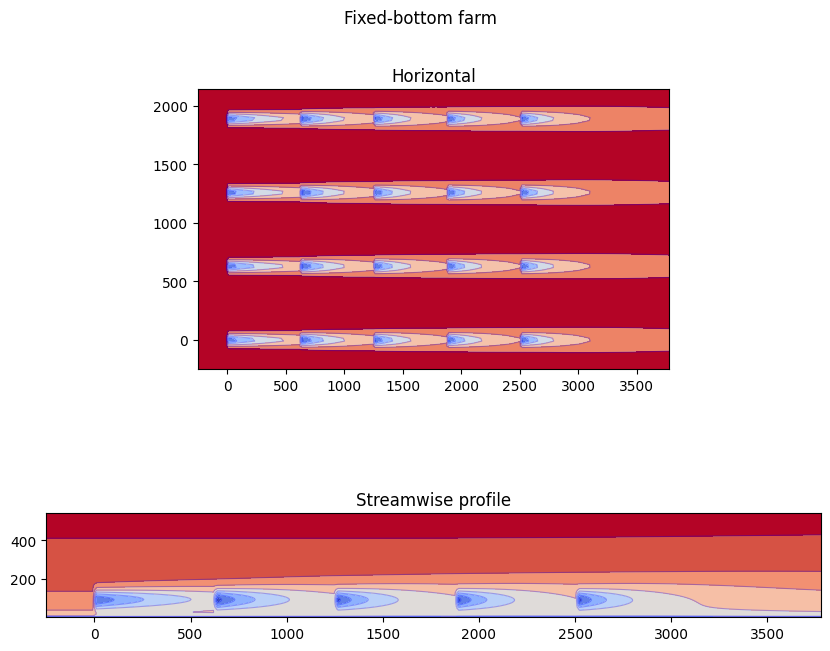
# Visualize flows (see also 02_visualizations.py)
horizontal_planes = []
y_planes = []
for fmodel in [fmodel_fixed, fmodel_floating]:
horizontal_planes.append(
fmodel.calculate_horizontal_plane(
x_resolution=200,
y_resolution=100,
height=90.0,
)
)
y_planes.append(
fmodel.calculate_y_plane(
x_resolution=200,
z_resolution=100,
crossstream_dist=0.0,
)
)
# Create the plots
fig, ax_list = plt.subplots(2, 1, figsize=(10, 8))
ax_list = ax_list.flatten()
flowviz.visualize_cut_plane(horizontal_planes[0], ax=ax_list[0], title="Horizontal")
flowviz.visualize_cut_plane(y_planes[0], ax=ax_list[1], title="Streamwise profile")
fig.suptitle("Fixed-bottom farm")
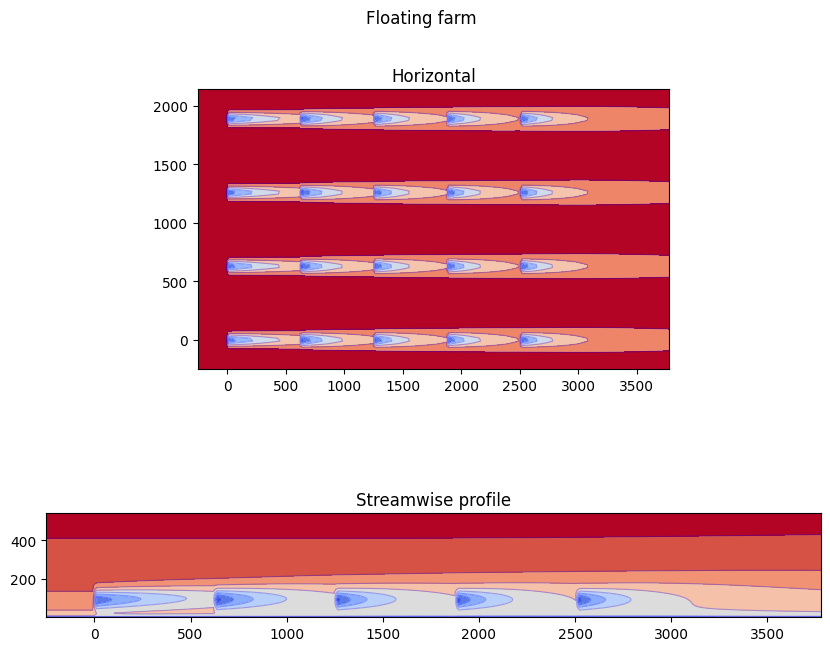
fig, ax_list = plt.subplots(2, 1, figsize=(10, 8))
ax_list = ax_list.flatten()
flowviz.visualize_cut_plane(horizontal_planes[1], ax=ax_list[0], title="Horizontal")
flowviz.visualize_cut_plane(y_planes[1], ax=ax_list[1], title="Streamwise profile")
fig.suptitle("Floating farm")
# Compute AEP
# Load the wind rose from csv as in example 003
wind_rose = WindRose.read_csv_long(
"../inputs/wind_rose.csv", wd_col="wd", ws_col="ws", freq_col="freq_val", ti_col_or_value=0.06
)
for fmodel in [fmodel_fixed, fmodel_floating]:
fmodel.set(
wind_data=wind_rose,
)
fmodel.run()
# Compute the AEP
aep_fixed = fmodel_fixed.get_farm_AEP()
aep_floating = fmodel_floating.get_farm_AEP()
print("Farm AEP (fixed bottom): {:.3f} GWh".format(aep_fixed / 1.0e9))
print("Farm AEP (floating): {:.3f} GWh".format(aep_floating / 1.0e9))
print(
"Floating AEP increase: {0:.3f} GWh ({1:.2f}%)".\
format((aep_floating - aep_fixed) / 1.0e9, (aep_floating - aep_fixed)/aep_fixed*100)
)
plt.show()
import warnings
warnings.filterwarnings('ignore')