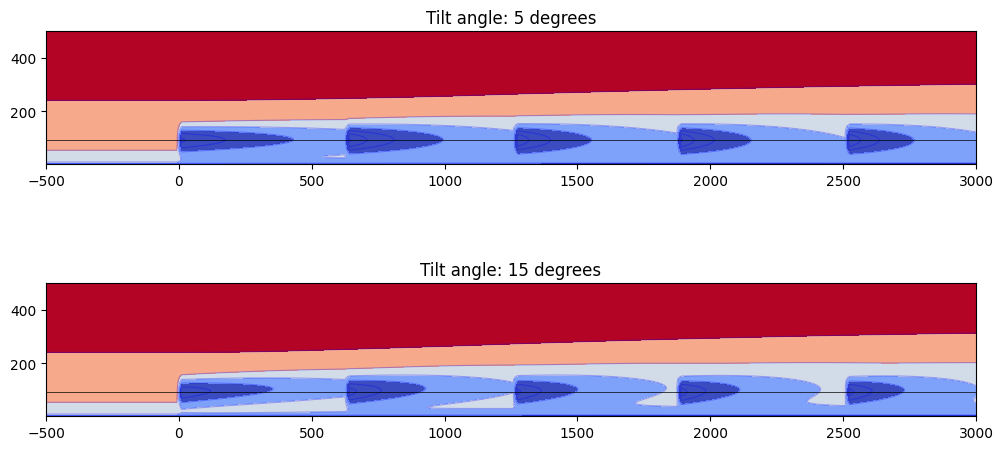
"""Example: Tilt-driven vertical wake deflection
This example demonstrates vertical wake deflections due to the tilt angle when running
with the Empirical Gauss model. Note that only the Empirical Gauss model implements
vertical deflections at this time. Also be aware that this example uses a potentially
unrealistic tilt angle, 15 degrees, to highlight the wake deflection. Moreover, the magnitude
of vertical deflections due to tilt has not been validated.
"""
import matplotlib.pyplot as plt
import numpy as np
from floris import FlorisModel
from floris.flow_visualization import visualize_cut_plane
# Initialize two FLORIS objects: one with 5 degrees of tilt (fixed across all
# wind speeds) and one with 15 degrees of tilt (fixed across all wind speeds).
fmodel_5 = FlorisModel("../inputs_floating/emgauss_floating_fixedtilt5.yaml")
fmodel_15 = FlorisModel("../inputs_floating/emgauss_floating_fixedtilt15.yaml")
D = fmodel_5.core.farm.rotor_diameters[0]
num_in_row = 5
# Figure settings
x_bounds = [-500, 3000]
y_bounds = [-250, 250]
z_bounds = [0.001, 500]
cross_plane_locations = [10, 1200, 2500]
horizontal_plane_location = 90.0
streamwise_plane_location = 0.0
# Create the plots
# Cutplane settings
cp_ls = "solid" # line style
cp_lw = 0.5 # line width
cp_clr = "black" # line color
min_ws = 4
max_ws = 10
fig = plt.figure()
fig.set_size_inches(12, 6)
powers = np.zeros((2, num_in_row))
# Calculate wakes, powers, plot
for i, (fmodel, tilt) in enumerate(zip([fmodel_5, fmodel_15], [5, 15])):
# Farm layout and wind conditions
fmodel.set(
layout_x=[x * 5.0 * D for x in range(num_in_row)],
layout_y=[0.0] * num_in_row,
wind_speeds=[8.0],
wind_directions=[270.0],
)
# Flow solve and power computation
fmodel.run()
powers[i, :] = fmodel.get_turbine_powers().flatten()
# Compute flow slices
y_plane = fmodel.calculate_y_plane(
x_resolution=200,
z_resolution=100,
crossstream_dist=streamwise_plane_location,
x_bounds=x_bounds,
z_bounds=z_bounds,
)
# Horizontal profile
ax = fig.add_subplot(2, 1, i + 1)
visualize_cut_plane(y_plane, ax=ax, min_speed=min_ws, max_speed=max_ws)
ax.plot(
x_bounds, [horizontal_plane_location] * 2, color=cp_clr, linewidth=cp_lw, linestyle=cp_ls
)
ax.set_title("Tilt angle: {0} degrees".format(tilt))
fig = plt.figure()
fig.set_size_inches(6, 4)
ax = fig.add_subplot(1, 1, 1)
x_locs = np.arange(num_in_row)
width = 0.25
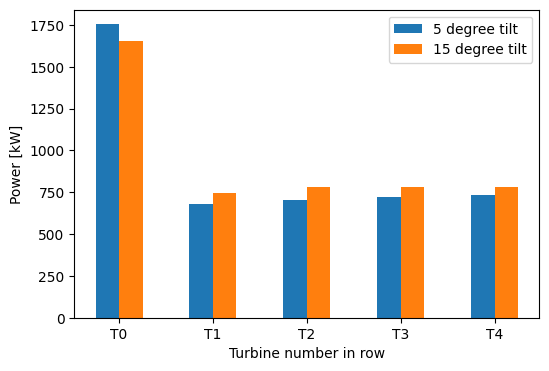
ax.bar(x_locs - width / 2, powers[0, :] / 1000, width=width, label="5 degree tilt")
ax.bar(x_locs + width / 2, powers[1, :] / 1000, width=width, label="15 degree tilt")
ax.set_xticks(x_locs)
ax.set_xticklabels(["T{0}".format(i) for i in range(num_in_row)])
ax.set_xlabel("Turbine number in row")
ax.set_ylabel("Power [kW]")
ax.legend()
plt.show()
import warnings
warnings.filterwarnings('ignore')