"""Example: Generate TI
Demonstrate usage of TI generating and plotting functionality in the WindRose
and TimeSeries classes
"""
import matplotlib.pyplot as plt
import numpy as np
from floris import (
TimeSeries,
WindRose,
)
# Generate a random time series of wind speeds, wind directions and turbulence intensities
wind_directions = np.array([250, 260, 270])
wind_speeds = np.array([5, 6, 7, 8, 9, 10])
ti_table = 0.06
# Declare a WindRose object
wind_rose = WindRose(wind_directions=wind_directions, wind_speeds=wind_speeds, ti_table=ti_table)
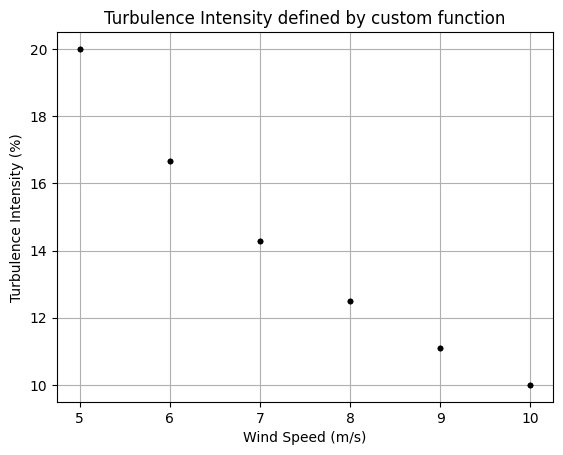
# Define a custom function where TI = 1 / wind_speed
def custom_ti_func(wind_directions, wind_speeds):
return 1 / wind_speeds
wind_rose.assign_ti_using_wd_ws_function(custom_ti_func)
fig, ax = plt.subplots()
wind_rose.plot_ti_over_ws(ax)
ax.set_title("Turbulence Intensity defined by custom function")
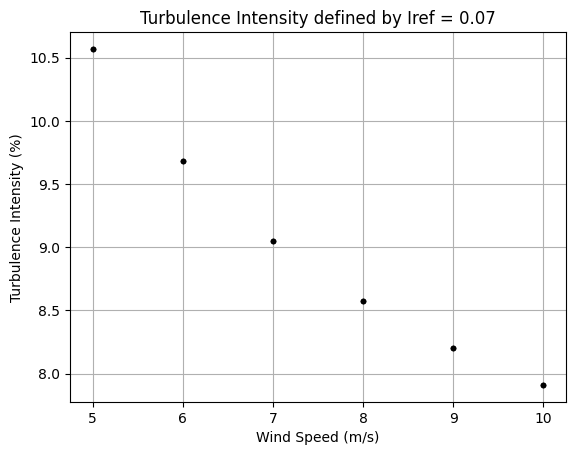
# Now use the normal turbulence model approach from the IEC 61400-1 standard,
# wherein TI is defined as a function of wind speed:
# Iref is defined as the TI value at 15 m/s. Note that Iref = 0.07 is lower
# than the values of Iref used in the IEC standard, but produces TI values more
# in line with those typically used in FLORIS (TI=8.6% at 8 m/s).
Iref = 0.07
wind_rose.assign_ti_using_IEC_method(Iref)
fig, ax = plt.subplots()
wind_rose.plot_ti_over_ws(ax)
ax.set_title(f"Turbulence Intensity defined by Iref = {Iref:0.2}")
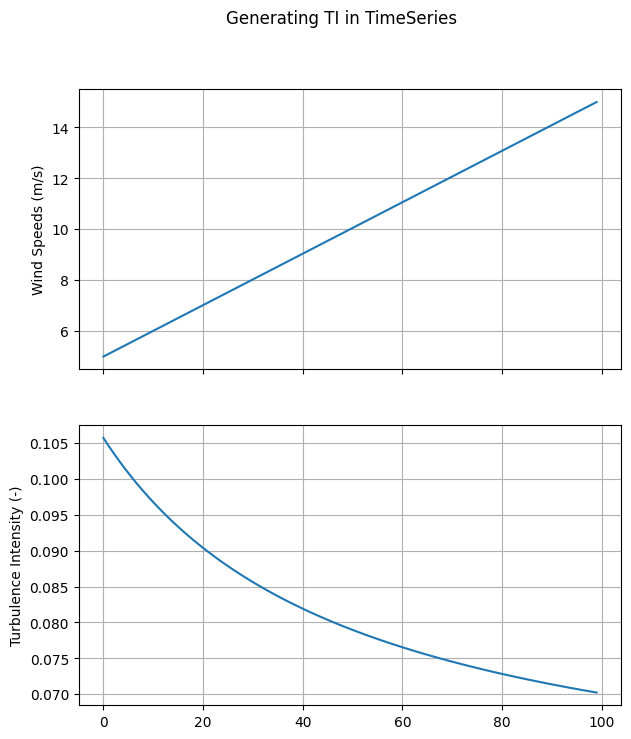
# Demonstrate equivalent usage in time series
N = 100
wind_directions = 270 * np.ones(N)
wind_speeds = np.linspace(5, 15, N)
turbulence_intensities = 0.06 * np.ones(N)
time_series = TimeSeries(
wind_directions=wind_directions,
wind_speeds=wind_speeds,
turbulence_intensities=turbulence_intensities
)
time_series.assign_ti_using_IEC_method(Iref=Iref)
fig, axarr = plt.subplots(2, 1, sharex=True, figsize=(7, 8))
ax = axarr[0]
ax.plot(wind_speeds)
ax.set_ylabel("Wind Speeds (m/s)")
ax.grid(True)
ax = axarr[1]
ax.plot(time_series.turbulence_intensities)
ax.set_ylabel("Turbulence Intensity (-)")
ax.grid(True)
fig.suptitle("Generating TI in TimeSeries")
plt.show()
import warnings
warnings.filterwarnings('ignore')