"""Example: Generate Example WRG File
This first example demonstrates the content and structure of a
Wind Resource Grid (WRG) file.
WRG files are Wind Resource Grid files, and their structure is
defined here:
https://backend.orbit.dtu.dk/ws/portalfiles/portal/116352660/WAsP_10_Help_Facility.pdf
In the script, a synthetic WRG file is derived using the WindRose class.
"""
import matplotlib.pyplot as plt
import numpy as np
from scipy.optimize import curve_fit
from floris import WindRose
# Define a function given the distribution of wind speeds in one sector,
# compute the A and k parameters of the Weibull distribution
def weibull_func(U, A, k):
return (k / A) * (U / A) ** (k - 1) * np.exp(-((U / A) ** k))
def estimate_weibull(U, freq):
# Normalize the frequency
freq = freq / freq.sum()
# Fit the Weibull distribution
popt, _ = curve_fit(weibull_func, U, freq, p0=(6.0, 2.0))
A_fit, k_fit = popt
return A_fit, k_fit
##################################################
# Parameters
##################################################
# Top line parameters
Nx = 2 # Number of grid points in x
Ny = 3 # Number of grid points in y
Xmin = 0.0 # Minimum value of x (m)
Ymin = 0.0 # Minimum value of y (m)
cell_size = 1000.0 # Grid spacing (m)
# Other fixed parameters
z_coord = 0.0 # z-coordinate of the grid
height_above_ground_level = 90.0 # Height above ground level
num_sectors = 12 # Number of direction sectors
##################################################
# Generating data
##################################################
# The above parameters define a 3x3 grid of points. Let's start
# by assuming the point at (0,0) has the wind rose as
# defined in inputs/wind_rose.csv
wind_rose_base = WindRose.read_csv_long(
"../inputs/wind_rose.csv", wd_col="wd", ws_col="ws", freq_col="freq_val", ti_col_or_value=0.06
)
# Resample to number of sectors
wind_rose_base = wind_rose_base.aggregate(wd_step=360 / num_sectors)
## Generate the other wind roses
# Assume that the wind roses at other points are generated by increasing
# the north winds with increasing y and east winds with increasing x
x_list = []
y_list = []
wind_rose_list = []
for xi in range(Nx):
for yi in range(Ny):
# Get the x and y locations for this point
x = Xmin + xi * cell_size
y = Ymin + yi * cell_size
x_list.append(x)
y_list.append(y)
# Instantiate the wind rose object
wind_rose = WindRose.read_csv_long(
"../inputs/wind_rose.csv",
wd_col="wd",
ws_col="ws",
freq_col="freq_val",
ti_col_or_value=0.06,
)
# Resample to number of sectors
wind_rose = wind_rose.aggregate(wd_step=360 / num_sectors)
# Copy the frequency table
freq_table = wind_rose.freq_table.copy()
# How much to shift the wind rose for this location
percent_x = xi / (Nx - 1)
percent_y = yi / (Ny - 1)
# East frequency scaling
east_row = freq_table[3, :]
shift_amount = percent_x * east_row[:5] * .9
east_row[:5] = east_row[:5] - shift_amount
east_row[5:10] = east_row[5:10] + shift_amount
freq_table[3, :] = east_row
# North frequency scaling
north_row = freq_table[0, :]
shift_amount = percent_y * north_row[:6] * .9
north_row[:6] = north_row[:6] - shift_amount
north_row[6:12] = north_row[6:12] + shift_amount
freq_table[0, :] = north_row
# Add to list
wind_rose_list.append(
WindRose(
wind_directions=wind_rose.wind_directions,
wind_speeds=wind_rose.wind_speeds,
ti_table=wind_rose.ti_table,
freq_table=freq_table,
)
)
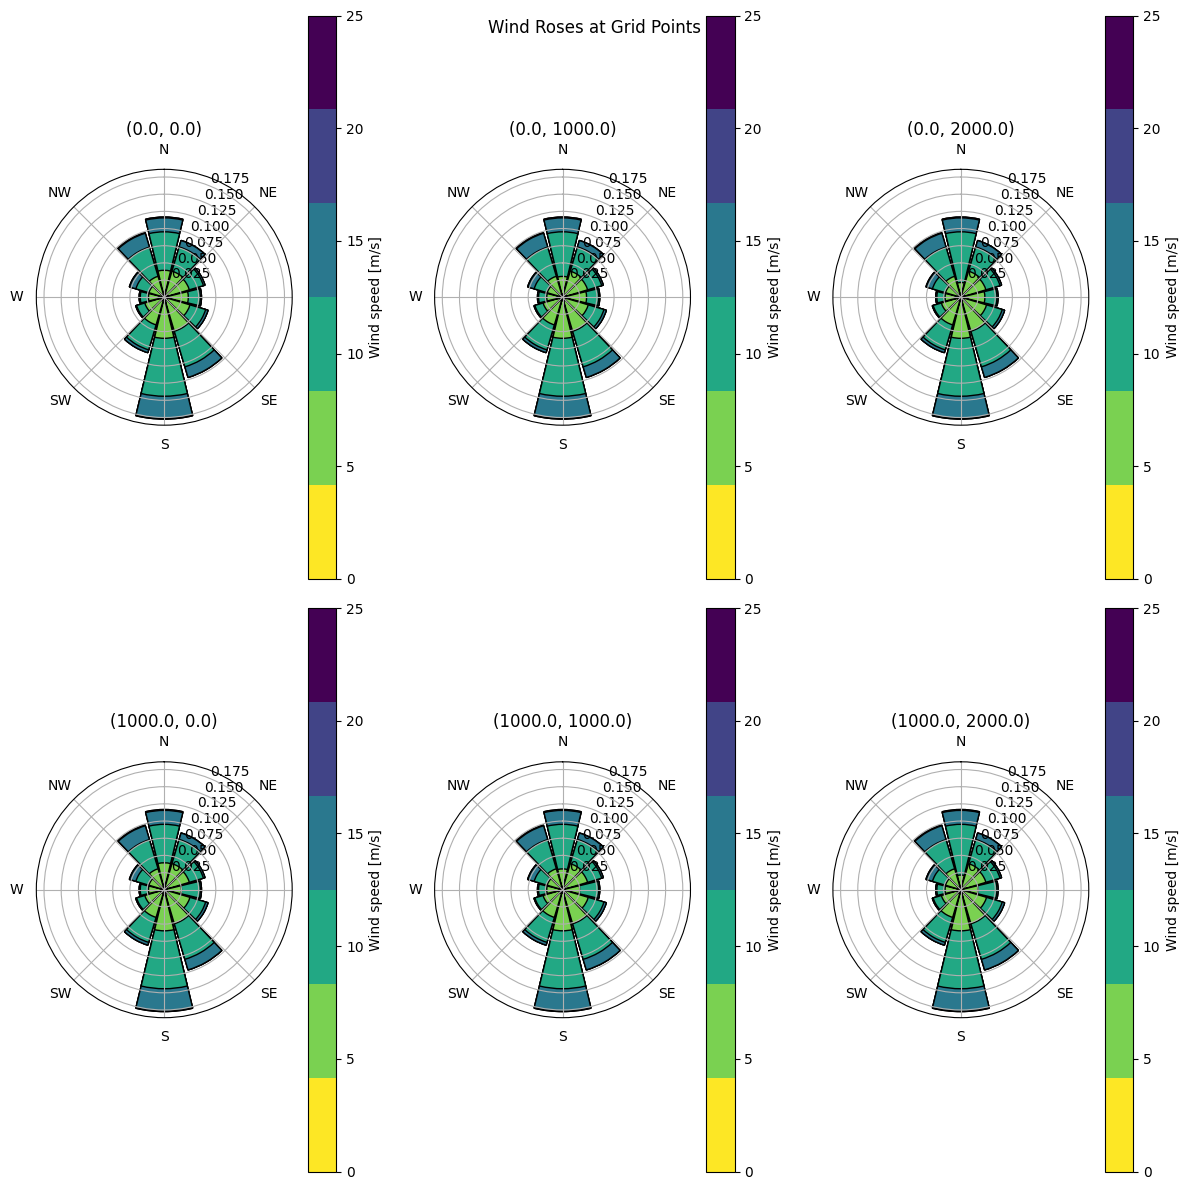
##################################################
# Show the wind roses in a grid
##################################################
fig, axarr = plt.subplots(Nx, Ny, figsize=(12, 12), subplot_kw={"polar": True})
axarr = axarr.flatten()
for i, wind_rose in enumerate(wind_rose_list):
wind_rose.plot(ax=axarr[i], ws_step=5)
axarr[i].set_title(f"({x_list[i]}, {y_list[i]})")
fig.suptitle("Wind Roses at Grid Points")
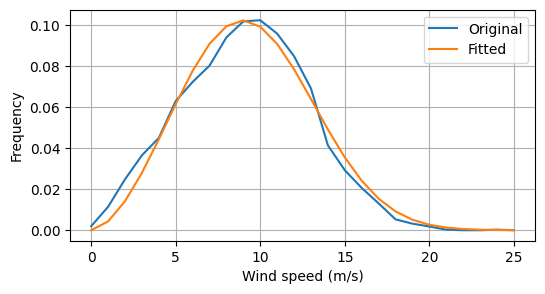
##################################################
# Demonstrate fitting the Weibull distribution
##################################################
freq_test = wind_rose_list[0].freq_table[0, :] / wind_rose_list[0].freq_table[0, :].sum()
a_test, k_test = estimate_weibull(wind_rose_list[0].wind_speeds, freq_test)
print(f"A: {a_test}, k: {k_test}")
fig, ax = plt.subplots(1, 1, figsize=(6, 3))
ax.plot(wind_rose_list[0].wind_speeds, freq_test, label="Original")
ax.plot(
wind_rose_list[0].wind_speeds,
weibull_func(wind_rose_list[0].wind_speeds, a_test, k_test),
label="Fitted",
)
ax.legend()
ax.set_xlabel("Wind speed (m/s)")
ax.set_ylabel("Frequency")
ax.grid(True)
##################################################
# Write out the WRG file
##################################################
# Open the file
with open("wrg_example.wrg", "w") as f:
# Write the top line of the file
f.write(f"{Nx} {Ny} {Xmin} {Ymin} {cell_size}\n")
# Now loop over the points
for i in range(Nx * Ny):
# Initiate the line to write as 10 blank spaces
line = " "
# Add the x-coodinate as a 10 character fixed width integer
line = line + f"{int(x_list[i]):10d}"
# Add the y-coodinate as a 10 character fixed width integer
line = line + f"{int(y_list[i]):10d}"
# Add the z-coodinate as a 10 character fixed width integer
line = line + f"{int(z_coord):8d}"
# Add the height above ground level as a 10 character fixed width integer
line = line + f"{int(height_above_ground_level):5d}"
# Get the wind rose for this point
wind_rose = wind_rose_list[i]
# Get the frequency matrix and wind speed
freq_table = wind_rose.freq_table
wind_speeds = wind_rose.wind_speeds
wind_directions = wind_rose.wind_directions
# Get the A and k parameters across all sectors
freq_table_ws = freq_table.sum(axis=0)
A, k = estimate_weibull(wind_speeds, freq_table_ws)
# Write the A and k parameters
line = line + f"{A:5.1f}{k:6.2f}"
# Add place holder 0 for the power density
line = line + f"{0:15d}"
# Write the number of sectors
line = line + f"{num_sectors:3d}"
# Get the frequency table across wind directions
freq_table_wd = freq_table.sum(axis=1)
# Step through the sectors
for wd_idx in range(num_sectors):
# Write the probability for this sector
line = line + f"{int(1000*freq_table_wd[wd_idx]):4d}"
# Get the A and k parameters for this sector
A, k = estimate_weibull(wind_speeds, freq_table[wd_idx, :])
# Write the A and k parameters
line = line + f"{int(A*10):4d}{int(k*100):5d}"
# Write the line to the file
f.write(line + "\n")
# Show the plots
plt.show()
import warnings
warnings.filterwarnings('ignore')