"""Example: Setting yaw angles and disabling turbine
This example demonstrates how to set yaw angles and disable turbines in FLORIS.
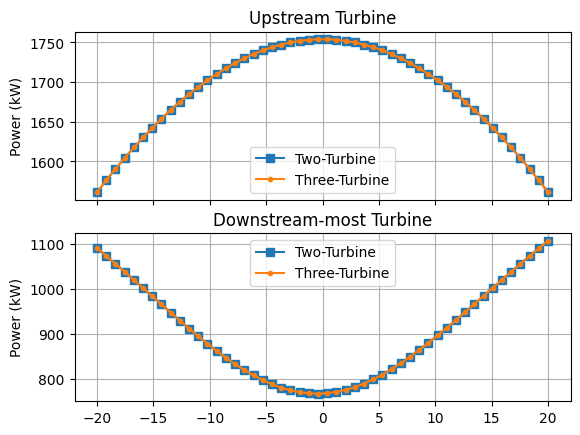
The yaw angles are set to sweep from -20 to 20 degrees for the upstream-most turbine
and to 0 degrees for the downstream-most turbine(s). A two-turbine case is compared
to a three-turbine case where the middle turbine is disabled making the two cases
functionally equivalent.
"""
import matplotlib.pyplot as plt
import numpy as np
from floris import FlorisModel, TimeSeries
# Initialize 2 FLORIS models, a two-turbine layout
# and three-turbine layout
fmodel_2 = FlorisModel("../inputs/gch.yaml")
fmodel_3 = FlorisModel("../inputs/gch.yaml")
# Change to the mixed model turbine
# This example sets both yaw angle and power setpoints
fmodel_2.set_operation_model("mixed")
fmodel_3.set_operation_model("mixed")
# Set the layouts, f_model_3 has an extra turbine in-between the two
# turbines of f_model_2
fmodel_2.set(layout_x=[0, 1000.0], layout_y=[0.0, 0.0])
fmodel_3.set(layout_x=[0, 500.0, 1000.0], layout_y=[0.0, 0.0, 0.0])
# Set bo
# Set both to have constant wind conditions
N = 50
time_series = TimeSeries(
wind_directions=270.0 * np.ones(N),
wind_speeds = 8.,
turbulence_intensities=0.06
)
fmodel_2.set(wind_data=time_series)
fmodel_3.set(wind_data=time_series)
# In both cases, set the yaw angles of the upstream-most turbine
# to sweep from -20 to 20 degrees, while other turbines are set to 0
upstream_yaw_angles = np.linspace(-20, 20, N)
yaw_angles_2 = np.array([upstream_yaw_angles, np.zeros(N)]).T
yaw_angles_3 = np.array([upstream_yaw_angles, np.zeros(N), np.zeros(N)]).T
# In the three turbine case, also disable the middle turbine
# Declare a np array of booleans that is Nx3 and whose middle column is True
disable_turbines = np.array([np.zeros(N), np.ones(N), np.zeros(N)]).T.astype(bool)
# Set the yaw angles for both and disable the middle turbine for the
# three turbine case
fmodel_2.set(yaw_angles=yaw_angles_2)
fmodel_3.set(yaw_angles=yaw_angles_3, disable_turbines=disable_turbines)
# Run both models
fmodel_2.run()
fmodel_3.run()
# Collect the turbine powers from both
turbine_powers_2 = fmodel_2.get_turbine_powers()
turbine_powers_3 = fmodel_3.get_turbine_powers()
# Make a 2-panel plot of the turbine powers. For the three-turbine case,
# only plot the first and last turbine
fig, axarr = plt.subplots(2, 1, sharex=True)
axarr[0].plot(upstream_yaw_angles, turbine_powers_2[:, 0] / 1000, label="Two-Turbine", marker='s')
axarr[0].plot(upstream_yaw_angles, turbine_powers_3[:, 0] / 1000, label="Three-Turbine", marker='.')
axarr[0].set_ylabel("Power (kW)")
axarr[0].legend()
axarr[0].grid(True)
axarr[0].set_title("Upstream Turbine")
axarr[1].plot(upstream_yaw_angles, turbine_powers_2[:, 1] / 1000, label="Two-Turbine", marker='s')
axarr[1].plot(upstream_yaw_angles, turbine_powers_3[:, 2] / 1000, label="Three-Turbine", marker='.')
axarr[1].set_ylabel("Power (kW)")
axarr[1].legend()
axarr[1].grid(True)
axarr[1].set_title("Downstream-most Turbine")
plt.show()
import warnings
warnings.filterwarnings('ignore')