"""Example: Floating turbines
This example demonstrates the impact of floating on turbine power and thrust (not wake behavior).
A floating turbine in FLORIS is defined by including a `floating_tilt_table` in the turbine
input yaml which sets the steady tilt angle of the turbine based on wind speed. This tilt angle
is computed for each turbine based on effective velocity. This tilt angle is then passed on
to the respective wake model.
The value of the parameter ref_tilt is the value of tilt at which the ct/cp curves
have been defined.
If `correct_cp_ct_for_tilt` is True, then the difference between the current tilt as
interpolated from the floating tilt table is used to scale the turbine power and thrust.
If `correct_cp_ct_for_tilt` is False, then it is assumed that the power/thrust coefficient tables
provided already account for the variation in tilt with wind speed (for example they were computed
from a turbine simulator with tilt degree-of-freedom enabled and the floating platform simulated),
and no correction is made.
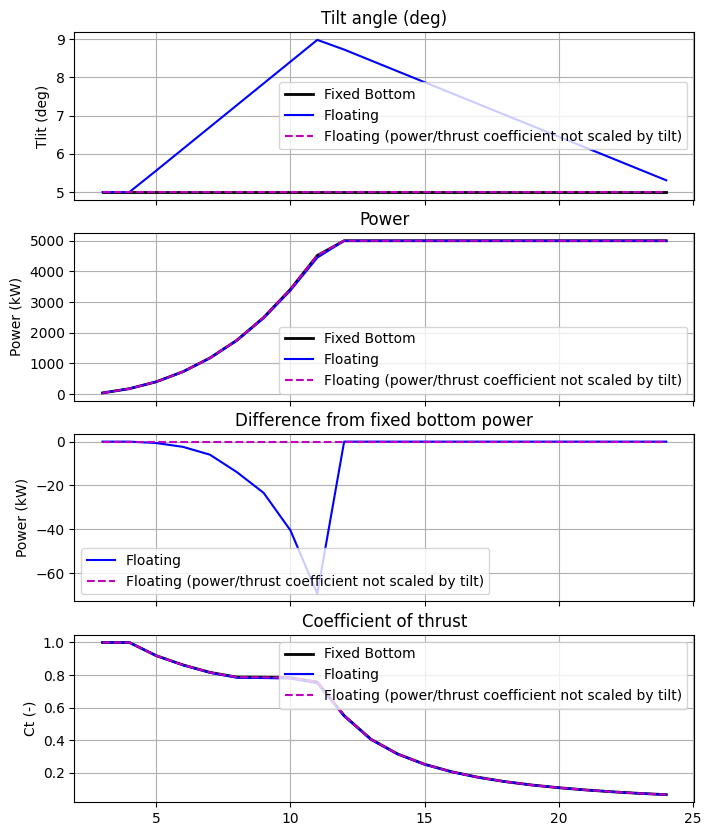
In the example below, three single-turbine simulations are run to show the different behaviors.
fmodel_fixed: Fixed bottom turbine (no tilt variation with wind speed)
fmodel_floating: Floating turbine (tilt varies with wind speed)
fmodel_floating_defined_floating: Floating turbine (tilt varies with wind speed, but
tilt does not scale power/thrust coefficient)
"""
import matplotlib.pyplot as plt
import numpy as np
from floris import FlorisModel, TimeSeries
# Create the Floris instances
fmodel_fixed = FlorisModel("../inputs_floating/gch_fixed.yaml")
fmodel_floating = FlorisModel("../inputs_floating/gch_floating.yaml")
fmodel_floating_defined_floating = FlorisModel(
"../inputs_floating/gch_floating_defined_floating.yaml"
)
# Calculate across wind speeds, while holding win directions constant
ws_array = np.arange(3.0, 25.0, 1.0)
time_series = TimeSeries(wind_directions=270.0, wind_speeds=ws_array, turbulence_intensities=0.06)
fmodel_fixed.set(wind_data=time_series)
fmodel_floating.set(wind_data=time_series)
fmodel_floating_defined_floating.set(wind_data=time_series)
fmodel_fixed.run()
fmodel_floating.run()
fmodel_floating_defined_floating.run()
# Grab power
power_fixed = fmodel_fixed.get_turbine_powers().flatten() / 1000.0
power_floating = fmodel_floating.get_turbine_powers().flatten() / 1000.0
power_floating_defined_floating = (
fmodel_floating_defined_floating.get_turbine_powers().flatten() / 1000.0
)
# Grab Ct
ct_fixed = fmodel_fixed.get_turbine_thrust_coefficients().flatten()
ct_floating = fmodel_floating.get_turbine_thrust_coefficients().flatten()
ct_floating_defined_floating = (
fmodel_floating_defined_floating.get_turbine_thrust_coefficients().flatten()
)
# Grab turbine tilt angles
eff_vels = fmodel_fixed.turbine_average_velocities
tilt_angles_fixed = np.squeeze(fmodel_fixed.core.farm.calculate_tilt_for_eff_velocities(eff_vels))
eff_vels = fmodel_floating.turbine_average_velocities
tilt_angles_floating = np.squeeze(
fmodel_floating.core.farm.calculate_tilt_for_eff_velocities(eff_vels)
)
eff_vels = fmodel_floating_defined_floating.turbine_average_velocities
tilt_angles_floating_defined_floating = np.squeeze(
fmodel_floating_defined_floating.core.farm.calculate_tilt_for_eff_velocities(eff_vels)
)
# Plot results
fig, axarr = plt.subplots(4, 1, figsize=(8, 10), sharex=True)
ax = axarr[0]
ax.plot(ws_array, tilt_angles_fixed, color="k", lw=2, label="Fixed Bottom")
ax.plot(ws_array, tilt_angles_floating, color="b", label="Floating")
ax.plot(
ws_array,
tilt_angles_floating_defined_floating,
color="m",
ls="--",
label="Floating (power/thrust coefficient not scaled by tilt)",
)
ax.grid(True)
ax.legend()
ax.set_title("Tilt angle (deg)")
ax.set_ylabel("Tlit (deg)")
ax = axarr[1]
ax.plot(ws_array, power_fixed, color="k", lw=2, label="Fixed Bottom")
ax.plot(ws_array, power_floating, color="b", label="Floating")
ax.plot(
ws_array,
power_floating_defined_floating,
color="m",
ls="--",
label="Floating (power/thrust coefficient not scaled by tilt)",
)
ax.grid(True)
ax.legend()
ax.set_title("Power")
ax.set_ylabel("Power (kW)")
ax = axarr[2]
# ax.plot(ws_array, power_fixed, color='k',label='Fixed Bottom')
ax.plot(ws_array, power_floating - power_fixed, color="b", label="Floating")
ax.plot(
ws_array,
power_floating_defined_floating - power_fixed,
color="m",
ls="--",
label="Floating (power/thrust coefficient not scaled by tilt)",
)
ax.grid(True)
ax.legend()
ax.set_title("Difference from fixed bottom power")
ax.set_ylabel("Power (kW)")
ax = axarr[3]
ax.plot(ws_array, ct_fixed, color="k", lw=2, label="Fixed Bottom")
ax.plot(ws_array, ct_floating, color="b", label="Floating")
ax.plot(
ws_array,
ct_floating_defined_floating,
color="m",
ls="--",
label="Floating (power/thrust coefficient not scaled by tilt)",
)
ax.grid(True)
ax.legend()
ax.set_title("Coefficient of thrust")
ax.set_ylabel("Ct (-)")
plt.show()
import warnings
warnings.filterwarnings('ignore')