"""Example: Optimize a row of turbines

This example optimizes the derating of a row of three turbines to maximize net revenue for a
variety of combinations of wind direction, ambient "load TI" (LTI), and electricity values.
The row is aligned when the wind direction is 270 degrees.

"""

import matplotlib.pyplot as plt
import numpy as np
import pandas as pd

from floris import FlorisModel, TimeSeries
from floris.core.turbine.operation_models import (
    POWER_SETPOINT_DEFAULT,
    POWER_SETPOINT_DISABLED,
)
from floris.optimization.load_optimization.load_optimization import (
    compute_farm_revenue,
    compute_farm_voc,
    compute_net_revenue,
    optimize_power_setpoints,
)


# Parameters
D = 126.0
d_spacing = 7.0
power_setpoint_levels = np.linspace(POWER_SETPOINT_DEFAULT, POWER_SETPOINT_DISABLED, 10)
n_turbines = 3
A = 4e-6  # Selected to demonstrate variation in derating selection

# Declare a floris model with default configuration
fmodel = FlorisModel(configuration="defaults")


# Set up a row of turbines
fmodel.set(
    layout_x=[i * D * d_spacing for i in range(n_turbines)],
    layout_y=[0.0 for i in range(n_turbines)],
)

# Set operation to simple derating
fmodel.set_operation_model("simple-derating")


# Set up input conditions
wind_directions = []
values = []
ambient_lti = []

for w_i in [240.0, 270.0]:
    for t_i in [0.1, 0.25]:
        for v_i in [1e-5, 1e-6]:
            wind_directions.append(w_i)
            values.append(v_i)
            ambient_lti.append(t_i)
wind_directions = np.array(wind_directions)
values = np.array(values)
ambient_lti = np.array(ambient_lti)
N = len(wind_directions)

time_series = TimeSeries(
    wind_directions=wind_directions, wind_speeds=8.0, turbulence_intensities=0.06, values=values
)

# Run the FLORIS model
fmodel.set(wind_data=time_series)
fmodel.run()

# Set the initial power setpoints as no derating
initial_power_setpoint = np.ones((N, n_turbines)) * 5e6

# Set these initial power setpoints
fmodel.set(power_setpoints=initial_power_setpoint)
fmodel.run()
net_revenue_initial = compute_net_revenue(fmodel, A, ambient_lti)
farm_voc_initial = compute_farm_voc(fmodel, A, ambient_lti)
farm_revenue_initial = compute_farm_revenue(fmodel)


# Compute the optimal derating levels given A_initial
opt_power_setpoints, opt_net_revenue = optimize_power_setpoints(
    fmodel,
    A,
    ambient_lti,
    power_setpoint_initial=initial_power_setpoint,
    power_setpoint_levels=power_setpoint_levels,
)

# Compute final values
fmodel.set(power_setpoints=opt_power_setpoints)
fmodel.run()
net_revenue_opt = compute_net_revenue(fmodel, A, ambient_lti)
farm_voc_opt = compute_farm_voc(fmodel, A, ambient_lti)
farm_revenue_opt = compute_farm_revenue(fmodel)


# Show the results
fig, axarr = plt.subplots(7, 1, sharex=True, figsize=(10, 9))

# Plot the wind direction
ax = axarr[0]
ax.plot(wind_directions, color="k")
ax.set_ylabel("Wind\n Direction (deg)", fontsize=7)
ax.set_title("X, Y Turbine Coordinates: T0: (0, 0), T1: (7D, 0), T2: (14D, 0); Wind Speed = 8 m/s")

# Plot the load TI
ax = axarr[1]
ax.plot(ambient_lti, color="k")
ax.set_ylabel("LTI (-)", fontsize=7)

# Plot the values
ax = axarr[2]
ax.plot(1e6 * values, color="k")
ax.set_ylabel("Value of\n Electricity ($/MWh)", fontsize=7)

# Plot the initial and final farm revenue
ax = axarr[3]
ax.plot(farm_revenue_initial, label="Initial", color="k")
ax.plot(farm_revenue_opt, label="Optimized", color="r")
ax.set_ylabel("Farm\n Revenue ($)", fontsize=7)
ax.legend()

# Plot the initial and final farm VOC
ax = axarr[4]
ax.plot(farm_voc_initial, label="Initial", color="k")
ax.plot(farm_voc_opt, label="Optimized", color="r")
ax.set_ylabel("Farm VOC ($)", fontsize=7)
ax.legend()

# Plot the initial and final farm net revenue
ax = axarr[5]
ax.plot(net_revenue_initial, label="Initial", color="k")
ax.plot(net_revenue_opt, label="Optimized", color="r")
ax.set_ylabel("Farm Net\nRevenue ($)", fontsize=7)
ax.legend()

# Plot the turbine deratings
ax = axarr[6]
for i in range(n_turbines):
    ax.plot(opt_power_setpoints[:, i] / 1000.0, label=f"Turbine {i}", lw=3 * n_turbines / (i + 1))
ax.set_ylabel("Power\n Setpoint (kW)", fontsize=7)
ax.set_xlabel("Wind Condition and Electricity Value Combination")
ax.legend()

for ax in axarr:
    ax.grid(True)


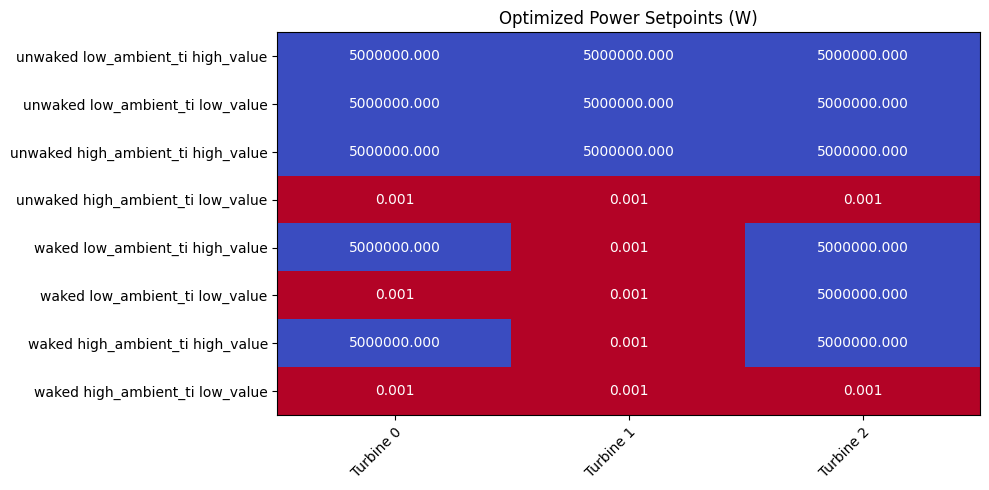
# Produce a heat-map to illustrate the chosen derating configurations by condition

# Make a list of strings whose value is "waked" when wind_directions is at its maximum
wake_status = ["waked" if wd == wind_directions.max() else "unwaked" for wd in wind_directions]

# Make a list of strings whose value is "high_ambient_ti"
# when ambient_lti is at its maximum, otherwise "low_ambient_ti"
ambient_status = [
    "high_ambient_ti" if ti == ambient_lti.max() else "low_ambient_ti" for ti in ambient_lti
]

# Make a list of strings whose value is "high_value" when values is at its maximum,
#  otherwise "low_value"
value_status = ["high_value" if v == values.max() else "low_value" for v in values]

# Cat the elements of each of these strings together
status = [f"{w} {a} {v}" for w, a, v in zip(wake_status, ambient_status, value_status)]

# Combine into a dataframe
df = pd.DataFrame(
    {
        "status": status,
        "Turbine 0": opt_power_setpoints[:, 0],
        "Turbine 1": opt_power_setpoints[:, 1],
        "Turbine 2": opt_power_setpoints[:, 2],
    }
)

df = df.set_index("status")


# Assuming your dataframe df is already set up as in your example
fig, ax = plt.subplots(figsize=(10, 5))

# Get the data values as a numpy array
data = df.values

# Create the heatmap
im = ax.imshow(data, cmap="coolwarm_r", aspect="auto")

# Add the annotations to the cells
for i in range(len(df.index)):
    for j in range(len(df.columns)):
        text = ax.text(j, i, f"{data[i, j]:.3f}", ha="center", va="center", color="w")

# Set title
ax.set_title("Optimized Power Setpoints (W)")

# Set x and y tick labels
ax.set_xticks(np.arange(len(df.columns)))
ax.set_yticks(np.arange(len(df.index)))
ax.set_xticklabels(df.columns)
ax.set_yticklabels(df.index)

# Rotate the x tick labels
plt.setp(ax.get_xticklabels(), rotation=45, ha="right", rotation_mode="anchor")

plt.tight_layout()
plt.show()
import warnings
warnings.filterwarnings('ignore')


