"""Example: Empirical Gaussian velocity deficit parameters
This example illustrates the main parameters of the Empirical Gaussian
velocity deficit model and their effects on the wind turbine wake.
"""
import copy
import matplotlib.pyplot as plt
import numpy as np
from floris import FlorisModel
from floris.flow_visualization import visualize_cut_plane
# Options
show_flow_cuts = True
num_in_row = 5
# Define function for visualizing wakes
def generate_wake_visualization(fmodel: FlorisModel, title=None):
# Using the FlorisModel functions, get 2D slices.
x_bounds = [-500, 3000]
y_bounds = [-250, 250]
z_bounds = [0.001, 500]
cross_plane_locations = [10, 1200, 2500]
horizontal_plane_location = 90.0
streamwise_plane_location = 0.0
# Contour plot colors
min_ws = 4
max_ws = 10
horizontal_plane = fmodel.calculate_horizontal_plane(
x_resolution=200,
y_resolution=100,
height=horizontal_plane_location,
x_bounds=x_bounds,
y_bounds=y_bounds,
)
y_plane = fmodel.calculate_y_plane(
x_resolution=200,
z_resolution=100,
crossstream_dist=streamwise_plane_location,
x_bounds=x_bounds,
z_bounds=z_bounds,
)
cross_planes = [
fmodel.calculate_cross_plane(y_resolution=100, z_resolution=100, downstream_dist=x)
for x in cross_plane_locations
]
# Create the plots
# Cutplane settings
cp_ls = "solid" # line style
cp_lw = 0.5 # line width
cp_clr = "black" # line color
fig = plt.figure()
fig.set_size_inches(12, 12)
# Horizontal profile
ax = fig.add_subplot(311)
visualize_cut_plane(
horizontal_plane, ax=ax, title="Top-down profile", min_speed=min_ws, max_speed=max_ws
)
ax.plot(
x_bounds, [streamwise_plane_location] * 2, color=cp_clr, linewidth=cp_lw, linestyle=cp_ls
)
for cpl in cross_plane_locations:
ax.plot([cpl] * 2, y_bounds, color=cp_clr, linewidth=cp_lw, linestyle=cp_ls)
ax = fig.add_subplot(312)
visualize_cut_plane(
y_plane, ax=ax, title="Streamwise profile", min_speed=min_ws, max_speed=max_ws
)
ax.plot(
x_bounds, [horizontal_plane_location] * 2, color=cp_clr, linewidth=cp_lw, linestyle=cp_ls
)
for cpl in cross_plane_locations:
ax.plot([cpl, cpl], z_bounds, color=cp_clr, linewidth=cp_lw, linestyle=cp_ls)
# Spanwise profiles
for i, (cp, cpl) in enumerate(zip(cross_planes, cross_plane_locations)):
visualize_cut_plane(
cp,
ax=fig.add_subplot(3, len(cross_planes), i + 7),
title="Loc: {:.0f}m".format(cpl),
min_speed=min_ws,
max_speed=max_ws,
)
# Add overall figure title
if title is not None:
fig.suptitle(title, fontsize=16)
## Main script
# Load input yaml and define farm layout
fmodel = FlorisModel("../inputs/emgauss.yaml")
D = fmodel.core.farm.rotor_diameters[0]
fmodel.set(
layout_x=[x * 5.0 * D for x in range(num_in_row)],
layout_y=[0.0] * num_in_row,
wind_speeds=[8.0],
wind_directions=[270.0],
)
# Save dictionary to modify later
fmodel_dict = fmodel.core.as_dict()
# Run wake calculation
fmodel.run()
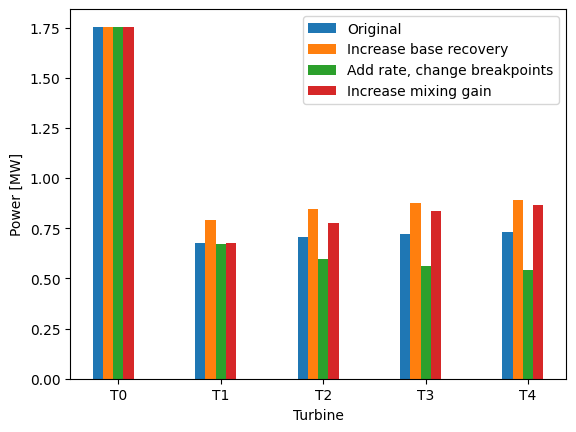
# Look at the powers of each turbine
turbine_powers = fmodel.get_turbine_powers().flatten() / 1e6
fig0, ax0 = plt.subplots(1, 1)
width = 0.1
nw = -2
x = np.array(range(num_in_row)) + width * nw
nw += 1
title = "Original"
ax0.bar(x, turbine_powers, width=width, label=title)
ax0.legend()
# Visualize wakes
if show_flow_cuts:
generate_wake_visualization(fmodel, title)
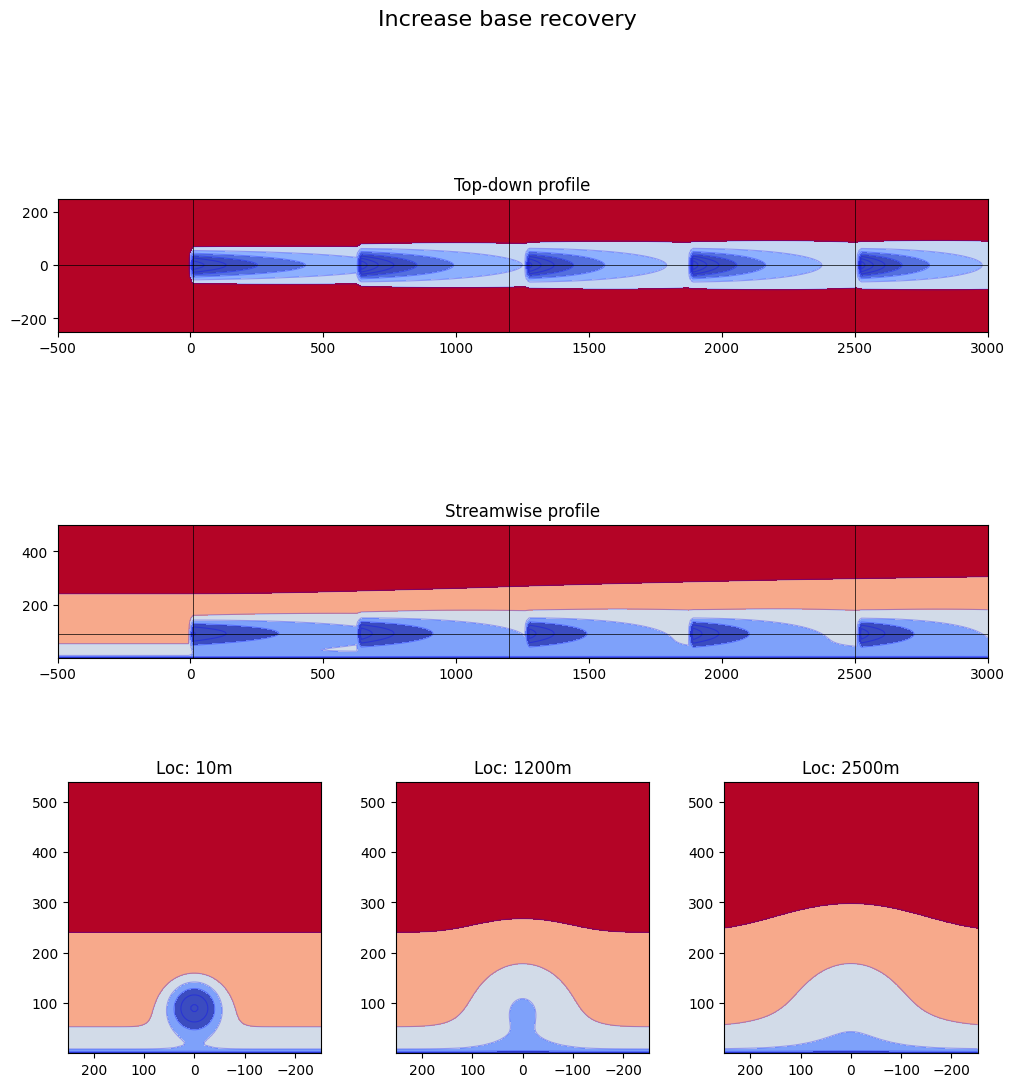
# Increase the base recovery rate
fmodel_dict_mod = copy.deepcopy(fmodel_dict)
fmodel_dict_mod["wake"]["wake_velocity_parameters"]["empirical_gauss"]["wake_expansion_rates"] = [
0.03,
0.015,
]
fmodel = FlorisModel(fmodel_dict_mod)
fmodel.set(wind_speeds=[8.0], wind_directions=[270.0])
fmodel.run()
turbine_powers = fmodel.get_turbine_powers().flatten() / 1e6
x = np.array(range(num_in_row)) + width * nw
nw += 1
title = "Increase base recovery"
ax0.bar(x, turbine_powers, width=width, label=title)
if show_flow_cuts:
generate_wake_visualization(fmodel, title)
# Add new expansion rate
fmodel_dict_mod = copy.deepcopy(fmodel_dict)
fmodel_dict_mod["wake"]["wake_velocity_parameters"]["empirical_gauss"]["wake_expansion_rates"] = (
fmodel_dict["wake"]["wake_velocity_parameters"]["empirical_gauss"]["wake_expansion_rates"]
+ [0.0]
)
fmodel_dict_mod["wake"]["wake_velocity_parameters"]["empirical_gauss"]["breakpoints_D"] = [5, 10]
fmodel = FlorisModel(fmodel_dict_mod)
fmodel.set(wind_speeds=[8.0], wind_directions=[270.0])
fmodel.run()
turbine_powers = fmodel.get_turbine_powers().flatten() / 1e6
x = np.array(range(num_in_row)) + width * nw
nw += 1
title = "Add rate, change breakpoints"
ax0.bar(x, turbine_powers, width=width, label=title)
if show_flow_cuts:
generate_wake_visualization(fmodel, title)
# Increase the wake-induced mixing gain
fmodel_dict_mod = copy.deepcopy(fmodel_dict)
fmodel_dict_mod["wake"]["wake_velocity_parameters"]["empirical_gauss"]["mixing_gain_velocity"] = 3.0
fmodel = FlorisModel(fmodel_dict_mod)
fmodel.set(wind_speeds=[8.0], wind_directions=[270.0])
fmodel.run()
turbine_powers = fmodel.get_turbine_powers().flatten() / 1e6
x = np.array(range(num_in_row)) + width * nw
nw += 1
title = "Increase mixing gain"
ax0.bar(x, turbine_powers, width=width, label=title)
if show_flow_cuts:
generate_wake_visualization(fmodel, title)
# Power plot aesthetics
ax0.set_xticks(range(num_in_row))
ax0.set_xticklabels(["T{0}".format(t) for t in range(num_in_row)])
ax0.legend()
ax0.set_xlabel("Turbine")
ax0.set_ylabel("Power [MW]")
plt.show()
import warnings
warnings.filterwarnings('ignore')