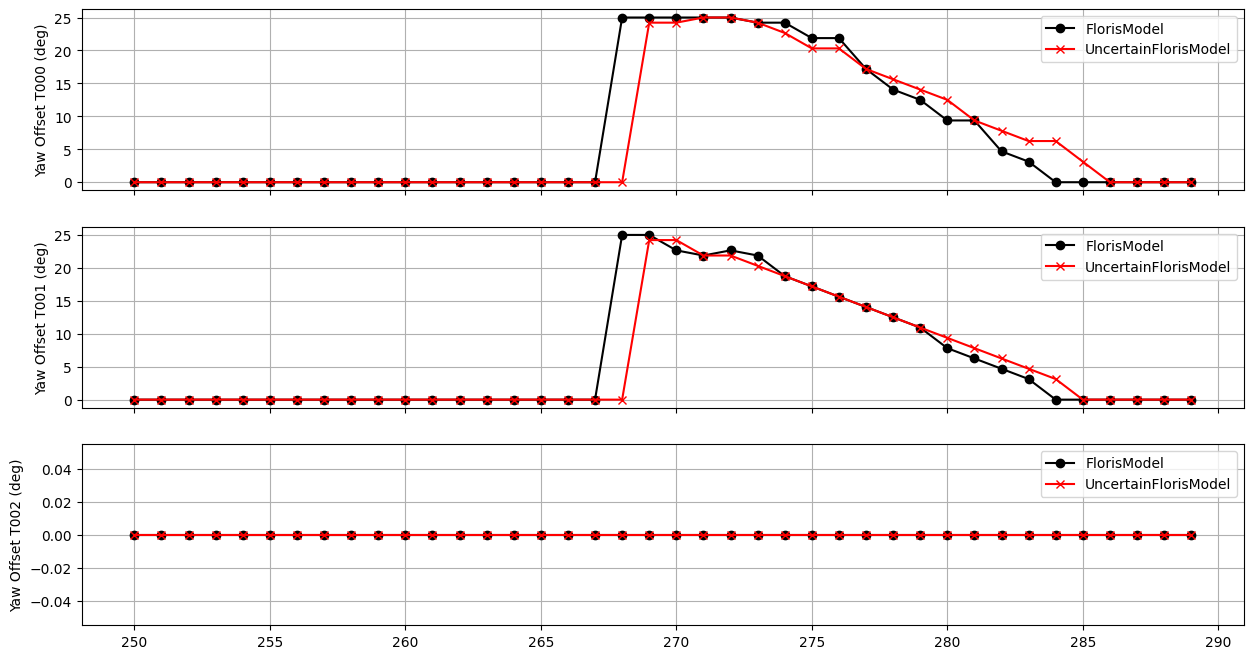
"""Example: Optimize yaw for a single wind speed and multiple wind directions.
Compare certain and uncertain results.

Use the serial-refine method to optimize the yaw angles for a 3-turbine wind farm.  In one
case use the FlorisModel without uncertainty and in the other use the UncertainFlorisModel
with a wind direction standard deviation of 3 degrees.  Compare the results.

"""

import matplotlib.pyplot as plt
import numpy as np

from floris import (
    FlorisModel,
    TimeSeries,
    UncertainFlorisModel,
)
from floris.optimization.yaw_optimization.yaw_optimizer_sr import YawOptimizationSR


# Load the  floris model and uncertain floris model
fmodel = FlorisModel("../inputs/gch.yaml")
ufmodel = UncertainFlorisModel("../inputs/gch.yaml", wd_std=3)


# Define an inflow that
# keeps wind speed and TI constant while sweeping the wind directions
wind_directions = np.arange(250, 290.0, 1.0)
time_series = TimeSeries(
    wind_directions=wind_directions,
    wind_speeds=8.0,
    turbulence_intensities=0.06,
)

# Reinitialize as a 3-turbine using the above inflow
D = 126.0  # Rotor diameter for the NREL 5 MW
fmodel.set(
    layout_x=[0.0, 5 * D, 10 * D],
    layout_y=[0.0, 0.0, 0.0],
    wind_data=time_series,
)
ufmodel.set(
    layout_x=[0.0, 5 * D, 10 * D],
    layout_y=[0.0, 0.0, 0.0],
    wind_data=time_series,
)

# Initialize optimizer object and run optimization using the Serial-Refine method
print("++++++++++CERTAIN++++++++++++")
yaw_opt = YawOptimizationSR(fmodel)
df_opt = yaw_opt.optimize()

# Repeat with uncertain model
print("++++++++++UNCERTAIN++++++++++++")
yaw_opt_u = YawOptimizationSR(ufmodel)
df_opt_uncertain = yaw_opt_u.optimize()

# Split out the turbine results
for t in range(3):
    df_opt["t%d" % t] = df_opt.yaw_angles_opt.apply(lambda x: x[t])
    df_opt_uncertain["t%d" % t] = df_opt_uncertain.yaw_angles_opt.apply(lambda x: x[t])

# Show the yaw and turbine results
fig, axarr = plt.subplots(3, sharex=True, sharey=False, figsize=(15, 8))

# Yaw results
for tindex in range(3):
    ax = axarr[tindex]
    ax.plot(
        df_opt.wind_direction, df_opt["t%d" % tindex], label="FlorisModel", color="k", marker="o"
    )
    ax.plot(
        df_opt_uncertain.wind_direction,
        df_opt_uncertain["t%d" % tindex],
        label="UncertainFlorisModel",
        color="r",
        marker="x",
    )
    ax.set_ylabel("Yaw Offset T{0:03d} (deg)".format(tindex))
    ax.legend()
    ax.grid(True)


# Power results
fig, axarr = plt.subplots(1, 2, figsize=(15, 5), sharex=True, sharey=True)
ax = axarr[0]
ax.plot(df_opt.wind_direction, df_opt.farm_power_baseline, color="k", label="Baseline Farm Power")
ax.plot(df_opt.wind_direction, df_opt.farm_power_opt, color="r", label="Optimized Farm Power")
ax.set_ylabel("Power (W)")
ax.set_xlabel("Wind Direction (deg)")
ax.legend()
ax.grid(True)
ax.set_title("Certain")
ax = axarr[1]
ax.plot(
    df_opt_uncertain.wind_direction,
    df_opt_uncertain.farm_power_baseline,
    color="k",
    label="Baseline Farm Power",
)
ax.plot(
    df_opt_uncertain.wind_direction,
    df_opt_uncertain.farm_power_opt,
    color="r",
    label="Optimized Farm Power",
)
ax.set_xlabel("Wind Direction (deg)")
ax.grid(True)
ax.set_title("Uncertain")


plt.show()
import warnings
warnings.filterwarnings('ignore')


