"""Example 8: Uncertain Models

UncertainFlorisModel is a class that adds uncertainty to the inflow wind direction
on the FlorisModel class. The UncertainFlorisModel class is interacted with in the
same manner as the FlorisModel class is. This example demonstrates how the
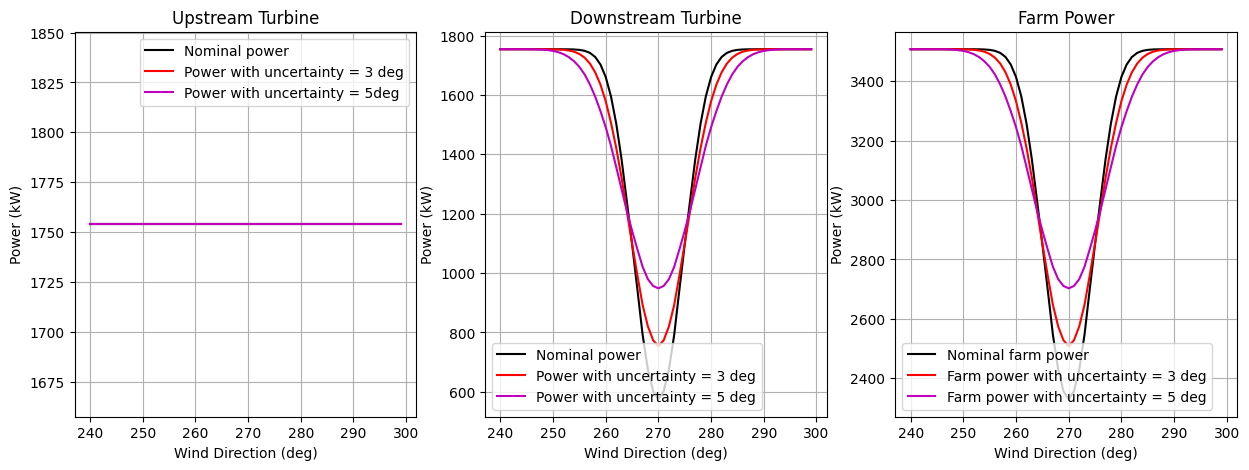
wind farm power production is calculated with and without uncertainty.
Other use cases of UncertainFlorisModel are, e.g., comparing FLORIS to
historical SCADA data and robust optimization.

For more details on using uncertain models, see further examples within the
examples_uncertain directory.

"""

import matplotlib.pyplot as plt
import numpy as np

from floris import (
    FlorisModel,
    TimeSeries,
    UncertainFlorisModel,
)


# Instantiate FLORIS FLORIS and UncertainFLORIS models
fmodel = FlorisModel("inputs/gch.yaml")  # GCH model

# The instantiation of the UncertainFlorisModel class is similar to the FlorisModel class
# with the addition of the wind direction standard deviation (wd_std) parameter
# and certain resolution parameters.  Internally, the UncertainFlorisModel class
# expands the wind direction time series to include the uncertainty but then
# only runs the unique cases.  The final result is computed via a gaussian weighting
# of the cases according to wd_std.  Here we use the default resolution parameters.
# wd_resolution=1.0,  # Degree
# ws_resolution=1.0,  # m/s
# ti_resolution=0.01,

ufmodel_3 = UncertainFlorisModel("inputs/gch.yaml", wd_std=3)
ufmodel_5 = UncertainFlorisModel("inputs/gch.yaml", wd_std=5)

# Define an inflow where wind direction is swept while
# wind speed and turbulence intensity are held constant
wind_directions = np.arange(240.0, 300.0, 1.0)
time_series = TimeSeries(
    wind_directions=wind_directions,
    wind_speeds=8.0,
    turbulence_intensities=0.06,
)

# Define a two turbine farm and apply the inflow
D = 126.0
layout_x = np.array([0, D * 6])
layout_y = [0, 0]

fmodel.set(
    layout_x=layout_x,
    layout_y=layout_y,
    wind_data=time_series,
)
ufmodel_3.set(
    layout_x=layout_x,
    layout_y=layout_y,
    wind_data=time_series,
)
ufmodel_5.set(
    layout_x=layout_x,
    layout_y=layout_y,
    wind_data=time_series,
)


# Run both models
fmodel.run()
ufmodel_3.run()
ufmodel_5.run()

# Collect the nominal and uncertain farm power
turbine_powers_nom = fmodel.get_turbine_powers() / 1e3
turbine_powers_unc_3 = ufmodel_3.get_turbine_powers() / 1e3
turbine_powers_unc_5 = ufmodel_5.get_turbine_powers() / 1e3
farm_powers_nom = fmodel.get_farm_power() / 1e3
farm_powers_unc_3 = ufmodel_3.get_farm_power() / 1e3
farm_powers_unc_5 = ufmodel_5.get_farm_power() / 1e3

# Plot results
fig, axarr = plt.subplots(1, 3, figsize=(15, 5))
ax = axarr[0]
ax.plot(wind_directions, turbine_powers_nom[:, 0].flatten(), color="k", label="Nominal power")
ax.plot(
    wind_directions,
    turbine_powers_unc_3[:, 0].flatten(),
    color="r",
    label="Power with uncertainty = 3 deg",
)
ax.plot(
    wind_directions,
    turbine_powers_unc_5[:, 0].flatten(),
    color="m",
    label="Power with uncertainty = 5deg",
)
ax.grid(True)
ax.legend()
ax.set_xlabel("Wind Direction (deg)")
ax.set_ylabel("Power (kW)")
ax.set_title("Upstream Turbine")

ax = axarr[1]
ax.plot(wind_directions, turbine_powers_nom[:, 1].flatten(), color="k", label="Nominal power")
ax.plot(
    wind_directions,
    turbine_powers_unc_3[:, 1].flatten(),
    color="r",
    label="Power with uncertainty = 3 deg",
)
ax.plot(
    wind_directions,
    turbine_powers_unc_5[:, 1].flatten(),
    color="m",
    label="Power with uncertainty = 5 deg",
)
ax.set_title("Downstream Turbine")
ax.grid(True)
ax.legend()
ax.set_xlabel("Wind Direction (deg)")
ax.set_ylabel("Power (kW)")

ax = axarr[2]
ax.plot(wind_directions, farm_powers_nom.flatten(), color="k", label="Nominal farm power")
ax.plot(
    wind_directions,
    farm_powers_unc_3.flatten(),
    color="r",
    label="Farm power with uncertainty = 3 deg",
)
ax.plot(
    wind_directions,
    farm_powers_unc_5.flatten(),
    color="m",
    label="Farm power with uncertainty = 5 deg",
)
ax.set_title("Farm Power")
ax.grid(True)
ax.legend()
ax.set_xlabel("Wind Direction (deg)")
ax.set_ylabel("Power (kW)")

# Compare the AEP calculation
freq = np.ones_like(wind_directions)
freq = freq / freq.sum()

aep_nom = fmodel.get_farm_AEP(freq=freq)
aep_unc_3 = ufmodel_3.get_farm_AEP(freq=freq)
aep_unc_5 = ufmodel_5.get_farm_AEP(freq=freq)

print(f"AEP without uncertainty {aep_nom}")
print(f"AEP without uncertainty (3 deg) {aep_unc_3} ({100*aep_unc_3/aep_nom:.2f}%)")
print(f"AEP without uncertainty (5 deg) {aep_unc_5} ({100*aep_unc_5/aep_nom:.2f}%)")


plt.show()
import warnings
warnings.filterwarnings('ignore')

