"""Example: Generate value
Demonstrate usage of value generating and plotting functionality in the WindRose
and TimeSeries classes. Value represents the value of the power or energy generated
at each time step or wind condition (e.g., the price of electricity in dollars/MWh).
This can then be used to compute the annual value production (AVP) instead of AEP,
or in later optimization methods to optimize for total value instead of energy.
"""
import matplotlib.pyplot as plt
import numpy as np
from floris import (
TimeSeries,
WindRose,
)
# Generate a random time series of wind speeds, wind directions and turbulence intensities
wind_directions = np.array([250, 260, 270])
wind_speeds = np.arange(3.0, 11.0, 1.0)
ti_table = 0.06
# Declare a WindRose object
wind_rose = WindRose(wind_directions=wind_directions, wind_speeds=wind_speeds, ti_table=ti_table)
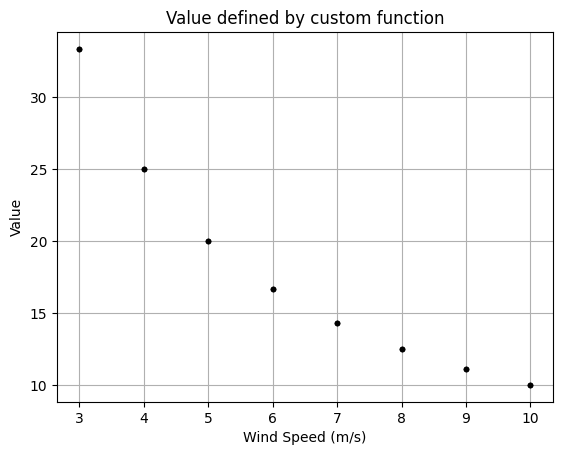
# Define a custom function where value = 100 / wind_speed
def custom_value_func(wind_directions, wind_speeds):
return 100 / wind_speeds
wind_rose.assign_value_using_wd_ws_function(custom_value_func)
fig, ax = plt.subplots()
wind_rose.plot_value_over_ws(ax)
ax.set_title("Value defined by custom function")
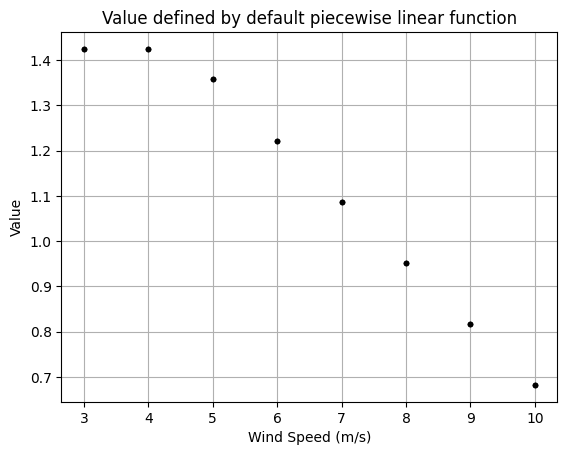
# Now assign value using the provided assign_value_piecewise_linear method with the default
# settings. This method assigns value based on a linear piecewise function of wind speed
# (with two line segments). The default arguments produce a value vs. wind speed that
# approximates the normalized mean electricity price vs. wind speed curve for the SPP market
# in the U.S. for years 2018-2020 from figure 7 in "The value of wake steering wind farm flow
# control in US energy markets," Wind Energy Science, 2024. https://doi.org/10.5194/wes-9-219-2024.
wind_rose.assign_value_piecewise_linear(
value_zero_ws=1.425,
ws_knee=4.5,
slope_1=0.0,
slope_2=-0.135
)
fig, ax = plt.subplots()
wind_rose.plot_value_over_ws(ax)
ax.set_title("Value defined by default piecewise linear function")
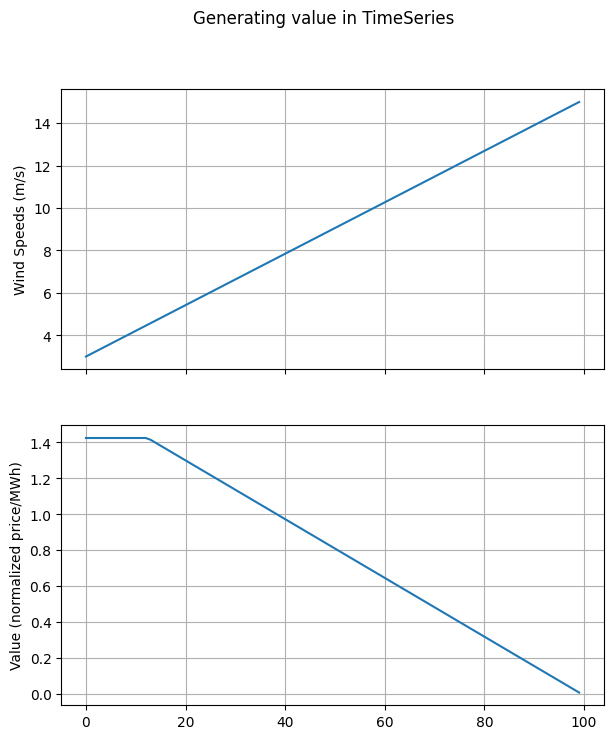
# Demonstrate equivalent usage in time series
N = 100
wind_directions = 270 * np.ones(N)
wind_speeds = np.linspace(3, 15, N)
turbulence_intensities = 0.06 * np.ones(N)
time_series = TimeSeries(
wind_directions=wind_directions,
wind_speeds=wind_speeds,
turbulence_intensities=turbulence_intensities
)
time_series.assign_value_piecewise_linear()
fig, axarr = plt.subplots(2, 1, sharex=True, figsize=(7, 8))
ax = axarr[0]
ax.plot(wind_speeds)
ax.set_ylabel("Wind Speeds (m/s)")
ax.grid(True)
ax = axarr[1]
ax.plot(time_series.values)
ax.set_ylabel("Value (normalized price/MWh)")
ax.grid(True)
fig.suptitle("Generating value in TimeSeries")
plt.show()
import warnings
warnings.filterwarnings('ignore')