"""Example: WindRoseWRG
`WindRoseWRG` is a type of WindData object, like `WindRose` and `TimeSeries`, that
is used to store wind data in a format that can be used by the FLORIS model. `WindRoseWRG`
is different that `WindRose` however because the internal data holds the information
of the WRG file and then a `WindRose` object is created for each turbine in a provided
layout.
In this example the WRG file generated in the previous example is read in
using the `WindRoseWRG` object, and wind roses as points on the WRG grid, as will
as in-between interpolated points have wind roses calculated using the `get_wind_rose_at_point`
method. Finally, the wind roses are upsampled to 5 degree wind direction bins and plotted.
"""
import matplotlib.pyplot as plt
import numpy as np
from floris import WindRoseWRG
# Read the WRG file
wind_rose_wrg = WindRoseWRG("wrg_example.wrg")
# Print some basic information
print(wind_rose_wrg)
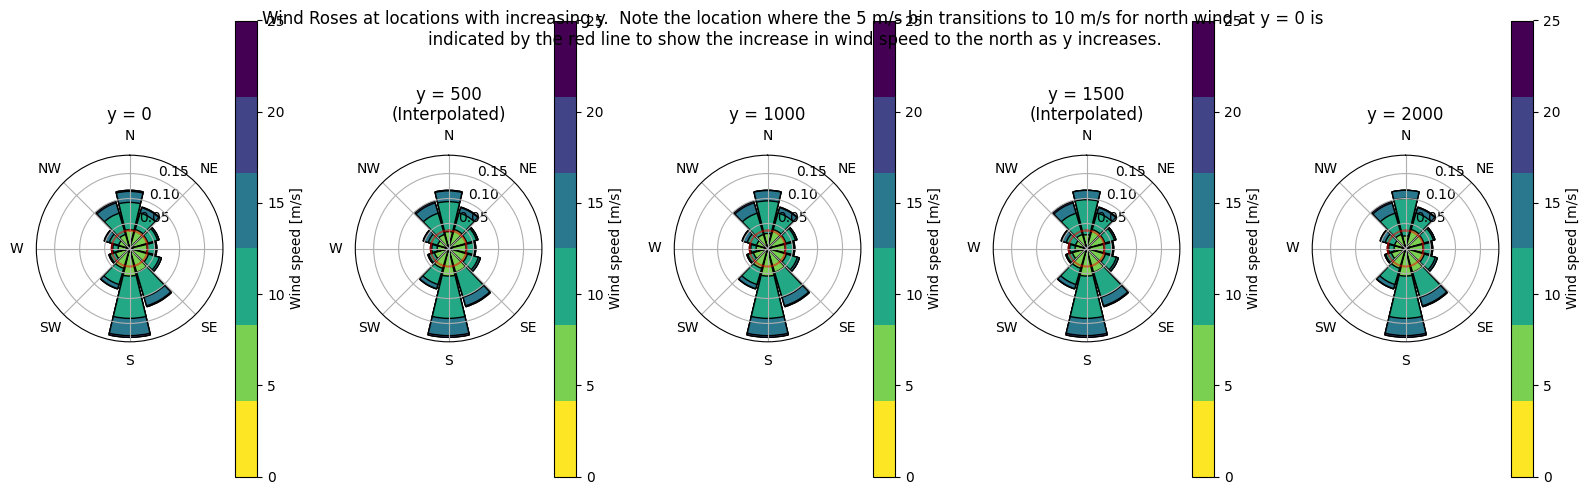
# The wind roses were set to have a higher concentration of faster north winds for
# increasing y, show that this is contained within the wind roses, even those interpolated
# between grid points
y_points_to_test = np.array([0, 500, 1000, 1500, 2000])
fig, axarr = plt.subplots(1, 5, figsize=(16, 5), subplot_kw={"polar": True})
for i in range(5):
wind_rose = wind_rose_wrg.get_wind_rose_at_point(0, y_points_to_test[i])
wind_rose.plot(ax=axarr[i], ws_step=5)
if i %2 == 0:
axarr[i].set_title(f"y = {y_points_to_test[i]}")
else:
axarr[i].set_title(f"y = {y_points_to_test[i]}\n(Interpolated)")
# Go through the axarr and delete the legends except for the middle
for ax in [axarr[0], axarr[1], axarr[3], axarr[4]]:
ax.legend().set_visible(False)
# Draw a horizontal line on each axis indicating the level of the lower wind speed
# bucket for the north wind from the first wind rose
for i in range(5):
axarr[i].axhline(y=0.036, color="red", alpha=0.5)
fig.suptitle("Wind Roses at locations with increasing y. Note the location where the 5 m/s bin \
transitions to 10 m/s for north wind at y = 0 is \nindicated by the red line to show \
the increase in wind speed to the north as y increases.")
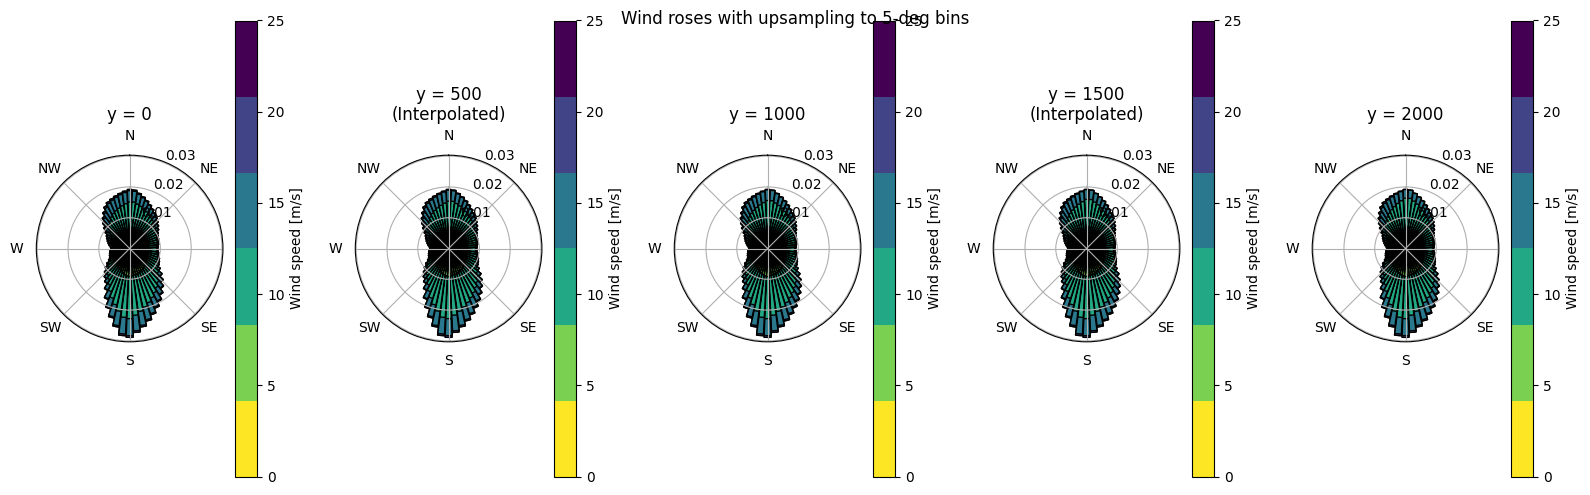
# Since wind directions was not specified, the wind directions implied by the number of sectors
# in the WRG was used, however the wind directions can be set using the set_wind_directions method
# or passed in at initialization. Here we upsample from 12, 30-deg sectors, to 72 5-deg sectors
wind_rose_wrg.set_wd_step(5.0)
fig, axarr = plt.subplots(1, 5, figsize=(16, 5), subplot_kw={"polar": True})
for i in range(5):
wind_rose = wind_rose_wrg.get_wind_rose_at_point(0, y_points_to_test[i])
wind_rose.plot(ax=axarr[i], ws_step=5)
if i %2 == 0:
axarr[i].set_title(f"y = {y_points_to_test[i]}")
else:
axarr[i].set_title(f"y = {y_points_to_test[i]}\n(Interpolated)")
# Go through the axarr and delete all the legends except for the middle
for ax in axarr:
ax.legend().set_visible(False)
fig.suptitle('Wind roses with upsampling to 5-deg bins')
plt.show()
import warnings
warnings.filterwarnings('ignore')