"""Example: Optimize yaw and compare AEP

This example demonstrates how to perform a yaw optimization and evaluate the performance
over a full wind rose.

The script performs the following steps:
    1. Load a wind rose from a csv file
    2. Calculates the optimal yaw angles for a wind speed of 8 m/s across the directions
    3. Applies the optimal yaw angles to the wind rose and calculates the AEP

"""

from time import perf_counter as timerpc

import matplotlib.pyplot as plt
import numpy as np

from floris import (
    FlorisModel,
    TimeSeries,
    WindRose,
)
from floris.optimization.yaw_optimization.yaw_optimizer_sr import YawOptimizationSR


# Load the wind rose from csv
wind_rose = WindRose.read_csv_long(
    "../inputs/wind_rose.csv", wd_col="wd", ws_col="ws", freq_col="freq_val", ti_col_or_value=0.06
)

# Load FLORIS
fmodel = FlorisModel("../inputs/gch.yaml")

# Specify wind farm layout and update in the floris object
N = 2  # number of turbines per row and per column
X, Y = np.meshgrid(
    5.0 * fmodel.core.farm.rotor_diameters_sorted[0][0] * np.arange(0, N, 1),
    5.0 * fmodel.core.farm.rotor_diameters_sorted[0][0] * np.arange(0, N, 1),
)
fmodel.set(layout_x=X.flatten(), layout_y=Y.flatten())

# Get the number of turbines
n_turbines = len(fmodel.layout_x)

# Optimize the yaw angles.  This could be done for every wind direction and wind speed
# but in practice it is much faster to optimize only for one speed and infer the rest
# using a rule of thumb
time_series = TimeSeries(
    wind_directions=wind_rose.wind_directions, wind_speeds=8.0, turbulence_intensities=0.06
)
fmodel.set(wind_data=time_series)

# Get the optimal angles
start_time = timerpc()
yaw_opt = YawOptimizationSR(
    fmodel=fmodel,
    minimum_yaw_angle=0.0,  # Allowable yaw angles lower bound
    maximum_yaw_angle=20.0,  # Allowable yaw angles upper bound
    Ny_passes=[5, 4],
    exclude_downstream_turbines=True,
)
df_opt = yaw_opt.optimize()
end_time = timerpc()
t_tot = end_time - start_time
print(f"Optimization finished in {t_tot:.2f} seconds.")


# Calculate the AEP in the baseline case
fmodel.set(wind_data=wind_rose)
fmodel.run()
farm_power_baseline = fmodel.get_farm_power()
aep_baseline = fmodel.get_farm_AEP()


# Now need to apply the optimal yaw angles to the wind rose to get the optimized AEP
# do this by applying a rule of thumb where the optimal yaw is applied between 6 and 12 m/s
# and ramped down to 0 above and below this range

# Grab wind speeds and wind directions from the fmodel.  Note that we do this because the
# yaw angles will need to be n_findex long, and accounting for the fact that some wind
# directions and wind speeds may not be present in the wind rose (0 frequency) and aren't
# included in the fmodel
wind_directions = fmodel.wind_directions
wind_speeds = fmodel.wind_speeds
n_findex = fmodel.n_findex


# Now define how the optimal yaw angles for 8 m/s are applied over the other wind speeds
yaw_angles_opt = np.vstack(df_opt["yaw_angles_opt"])
yaw_angles_wind_rose = np.zeros((n_findex, n_turbines))
for i in range(n_findex):
    wind_speed = wind_speeds[i]
    wind_direction = wind_directions[i]

    # Interpolate the optimal yaw angles for this wind direction from df_opt
    id_opt = df_opt["wind_direction"] == wind_direction
    yaw_opt_full = np.array(df_opt.loc[id_opt, "yaw_angles_opt"])[0]

    # Now decide what to do for different wind speeds
    wind_speed_low_no_steer = 4.0
    wind_speed_high_no_steer = 14.0
    wind_speed_low_steer = 6.0
    wind_speed_high_steer = 12.0
    if (wind_speed < wind_speed_low_no_steer) | (wind_speed > wind_speed_high_no_steer):
        yaw_opt = np.zeros(n_turbines)  # do nothing for very low/high speeds
    elif wind_speed < wind_speed_low_steer:
        yaw_opt = (
            yaw_opt_full
            * (wind_speed_low_steer - wind_speed)
            / (wind_speed_low_steer - wind_speed_low_no_steer)
        )  # Linear ramp up
    elif wind_speed > wind_speed_high_steer:
        yaw_opt = (
            yaw_opt_full
            * (wind_speed_high_no_steer - wind_speed)
            / (wind_speed_high_no_steer - wind_speed_high_steer)
        )  # Linear ramp down
    else:
        yaw_opt = yaw_opt_full  # Apply full offsets between 6.0 and 12.0 m/s

    # Save to collective array
    yaw_angles_wind_rose[i, :] = yaw_opt


# Now apply the optimal yaw angles and get the AEP
fmodel.set(yaw_angles=yaw_angles_wind_rose)
fmodel.run()
aep_opt = fmodel.get_farm_AEP()
aep_uplift = 100.0 * (aep_opt / aep_baseline - 1)
farm_power_opt = fmodel.get_farm_power()

print(f"Baseline AEP: {aep_baseline / 1e9:.2f} GWh.")
print(f"Optimal AEP: {aep_opt / 1e9:.2f} GWh.")
print(f"Relative AEP uplift by wake steering: {aep_uplift:.3f} %.")

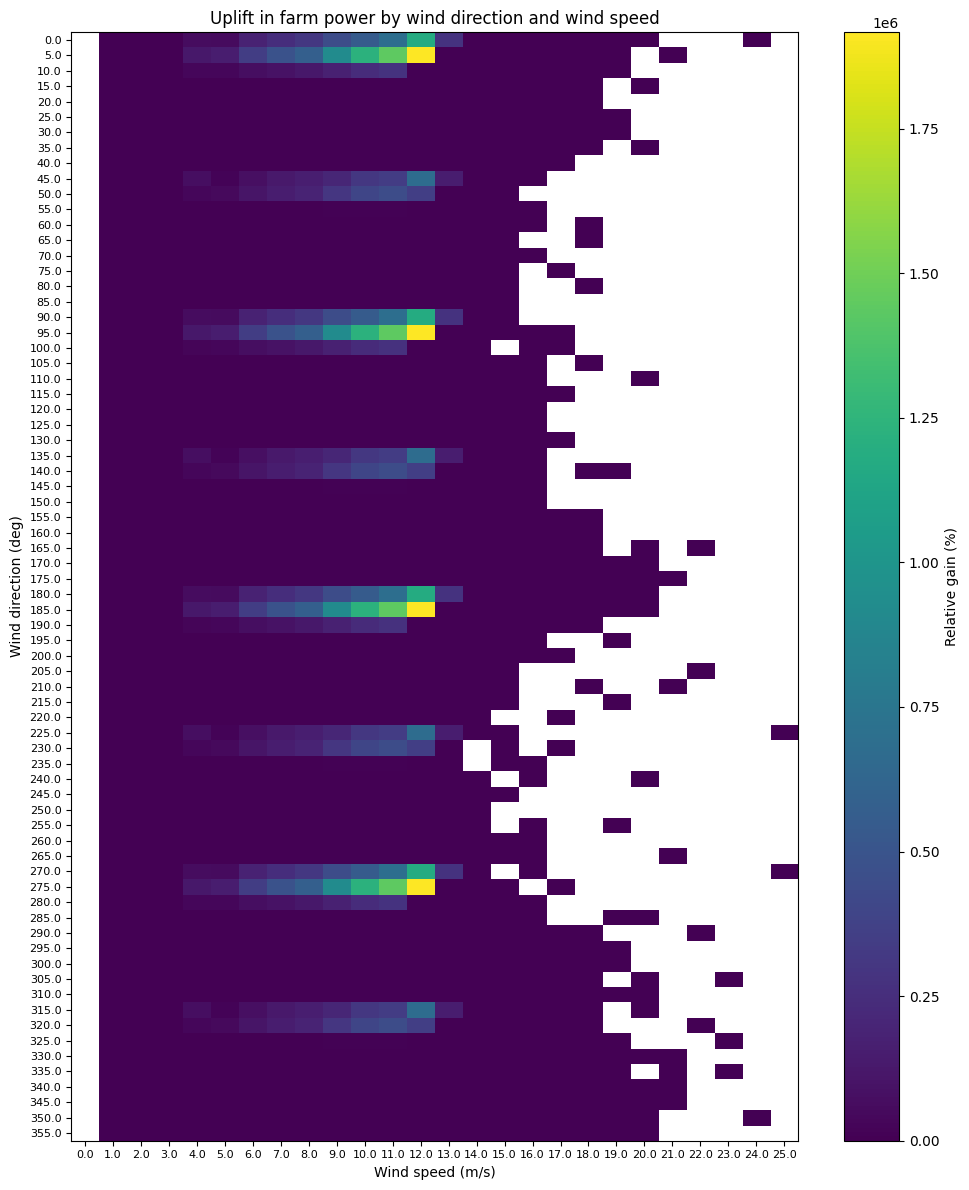
# Use farm_power_baseline, farm_power_opt and wind_data to make a heat map of uplift by
# wind direction and wind speed
wind_directions = wind_rose.wind_directions
wind_speeds = wind_rose.wind_speeds
relative_gain = farm_power_opt - farm_power_baseline

# Plot the heatmap with wind speeds on x, wind directions on y and relative gain as the color
fig, ax = plt.subplots(figsize=(10, 12))
cax = ax.imshow(relative_gain, cmap="viridis", aspect="auto")
fig.colorbar(cax, ax=ax, label="Relative gain (%)")

ax.set_yticks(np.arange(len(wind_directions)))
ax.set_yticklabels(wind_directions)
ax.set_xticks(np.arange(len(wind_speeds)))
ax.set_xticklabels(wind_speeds)
ax.set_ylabel("Wind direction (deg)")
ax.set_xlabel("Wind speed (m/s)")

# Reduce x and y tick font size
for tick in ax.yaxis.get_major_ticks():
    tick.label1.set_fontsize(8)

for tick in ax.xaxis.get_major_ticks():
    tick.label1.set_fontsize(8)

# Set y ticks to be horizontal
for tick in ax.get_yticklabels():
    tick.set_rotation(0)

ax.set_title("Uplift in farm power by wind direction and wind speed", fontsize=12)

plt.tight_layout()
plt.show()
import warnings
warnings.filterwarnings('ignore')

