"""Example: Heterogeneous Speedup by Wind Direction and Wind Speed
The HeterogeneousMap object is a flexible way to define speedups as a function of wind direction
and/or wind speed. It also contains methods to plot the speedup map for a given wind direction
and wind speed.
This example:
1) Instantiates a HeterogeneousMap object with speedups defined for two wind directions
and two wind speeds
2) Visualizes the speedups for two particular combinations of wind direction and wind speed
3) Runs a FLORIS simulation using the HeterogeneousMap and visualizes the results
"""
import matplotlib.pyplot as plt
import numpy as np
from floris import (
FlorisModel,
HeterogeneousMap,
TimeSeries,
)
from floris.flow_visualization import visualize_heterogeneous_cut_plane
# Define a HeterogeneousMap object with speedups defined for two wind directions
# and two wind speeds. The speedups imply no heterogeneity for the first wind direction
# (0 degrees) with heterogeneity for the second wind direction (180 degrees) with the
# specific speedups for this direction depending on the wind speed.
heterogeneous_map = HeterogeneousMap(
x=np.array([0.0, 0.0, 250.0, 500.0, 500.0]),
y=np.array([0.0, 500.0, 250.0, 0.0, 500.0]),
speed_multipliers=np.array(
[
[1.0, 1.0, 1.0, 1.0, 1.0],
[1.0, 1.0, 1.0, 1.0, 1.0],
[1.5, 1.0, 1.25, 1.5, 1.0],
[1.0, 1.5, 1.25, 1.0, 1.5],
]
),
wind_directions=np.array([270.0, 270.0, 90.0, 90.0]),
wind_speeds=np.array([5.0, 10.0, 5.0, 10.0]),
)
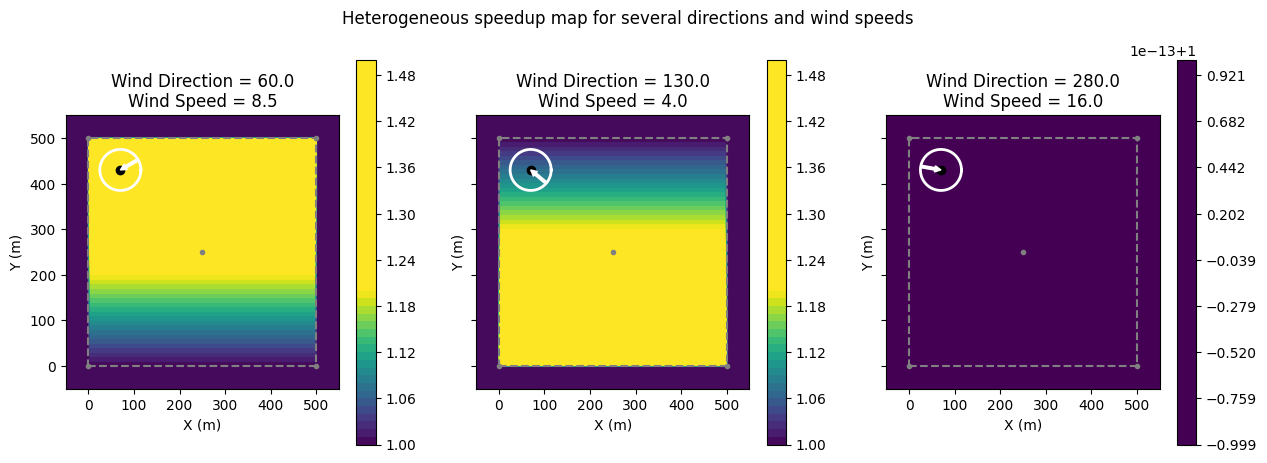
# Use the HeterogeneousMap object to plot the speedup map for 3 wd/ws combinations
fig, axarr = plt.subplots(1, 3, sharex=True, sharey=True, figsize=(15, 5))
ax = axarr[0]
heterogeneous_map.plot_single_speed_multiplier(
wind_direction=60.0, wind_speed=8.5, ax=ax, vmin=1.0, vmax=1.2
)
ax.set_title("Wind Direction = 60.0\nWind Speed = 8.5")
ax = axarr[1]
heterogeneous_map.plot_single_speed_multiplier(
wind_direction=130.0, wind_speed=4.0, ax=ax, vmin=1.0, vmax=1.2
)
ax.set_title("Wind Direction = 130.0\nWind Speed = 4.0")
ax = axarr[2]
heterogeneous_map.plot_single_speed_multiplier(
wind_direction=280.0, wind_speed=16.0, ax=ax, vmin=1.0, vmax=1.2
)
ax.set_title("Wind Direction = 280.0\nWind Speed = 16.0")
fig.suptitle("Heterogeneous speedup map for several directions and wind speeds")
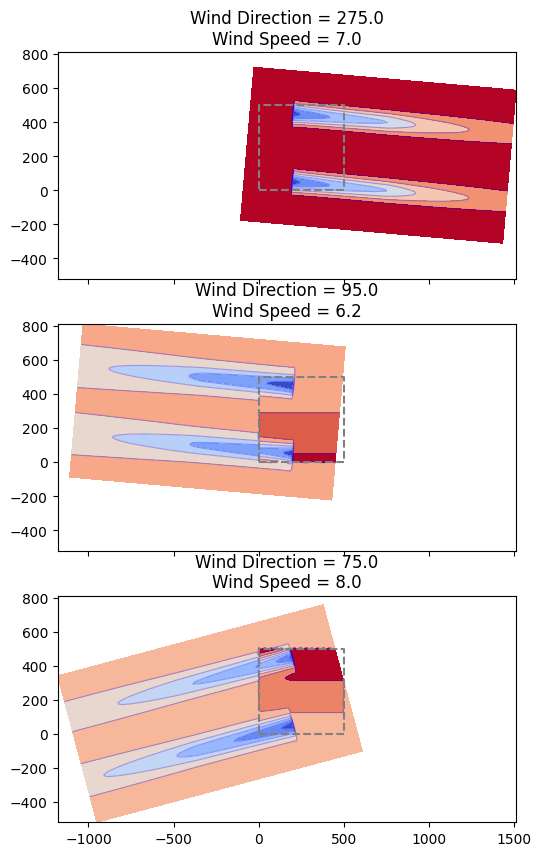
# Initialize FlorisModel
fmodel = FlorisModel("../inputs/gch.yaml")
# Change the layout to a 2 turbine layout within the heterogeneous domain
fmodel.set(layout_x=[200, 200.0], layout_y=[50, 450.0])
# Define a TimeSeries object with 3 wind directions and wind speeds
# and turbulence intensity and using the above HeterogeneousMap object
time_series = TimeSeries(
wind_directions=np.array([275.0, 95.0, 75.0]),
wind_speeds=np.array([7.0, 6.2, 8.0]),
turbulence_intensities=0.06,
heterogeneous_map=heterogeneous_map,
)
# Apply the time series to the FlorisModel
fmodel.set(wind_data=time_series)
# Run the FLORIS simulation
fmodel.run()
# Visualize each of the findices
fig, axarr = plt.subplots(3, 1, sharex=True, sharey=True, figsize=(10, 10))
for findex in range(3):
ax = axarr[findex]
horizontal_plane = fmodel.calculate_horizontal_plane(
x_resolution=200, y_resolution=100, height=90.0, findex_for_viz=findex
)
visualize_heterogeneous_cut_plane(
cut_plane=horizontal_plane,
fmodel=fmodel,
ax=ax,
title=(
f"Wind Direction = {time_series.wind_directions[findex]}\n"
f"Wind Speed = {time_series.wind_speeds[findex]}"
),
)
plt.show()
import warnings
warnings.filterwarnings('ignore')