"""Example 5: Getting Turbine and Farm Power
After setting the FlorisModel and running, the next step is typically to get the power output
of the turbines. FLORIS has several methods for getting power:
1. `get_turbine_powers()`: Returns the power output of each turbine in the farm for each findex
(n_findex, n_turbines)
2. `get_farm_power()`: Returns the total power output of the farm for each findex (n_findex)
3. `get_expected_farm_power()`: Returns the combination of the farm power over each findex
with the frequency of each findex to get the expected farm power
4. `get_farm_AEP()`: Multiplies the expected farm power by the number of hours in a year to get
the expected annual energy production (AEP) of the farm
"""
import matplotlib.pyplot as plt
import numpy as np
from floris import (
FlorisModel,
TimeSeries,
WindRose,
)
fmodel = FlorisModel("inputs/gch.yaml")
# Set to a 3-turbine layout
fmodel.set(layout_x=[0, 126 * 5, 126 * 10], layout_y=[0, 0, 0])
######################################################
# Using TimeSeries
######################################################
# Set up a time series in which the wind speed and TI are constant but the wind direction
# sweeps the range from 250 to 290 degrees
wind_directions = np.arange(250, 290, 1.0)
time_series = TimeSeries(
wind_directions=wind_directions, wind_speeds=9.9, turbulence_intensities=0.06
)
fmodel.set(wind_data=time_series)
# Run the model
fmodel.run()
# Get the turbine powers
turbine_powers = fmodel.get_turbine_powers()
# Turbines powers will have shape (n_findex, n_turbines) where n_findex is the number of unique
# wind conditions and n_turbines is the number of turbines in the farm
print(f"Turbine power has shape {turbine_powers.shape}")
# It is also possible to get the farm power directly
farm_power = fmodel.get_farm_power()
# Farm power has length n_findex, and is the sum of the turbine powers
print(f"Farm power has shape {farm_power.shape}")
# It's possible to get these powers with wake losses disabled, this can be useful
# for computing total wake losses
fmodel.run_no_wake()
farm_power_no_wake = fmodel.get_farm_power()
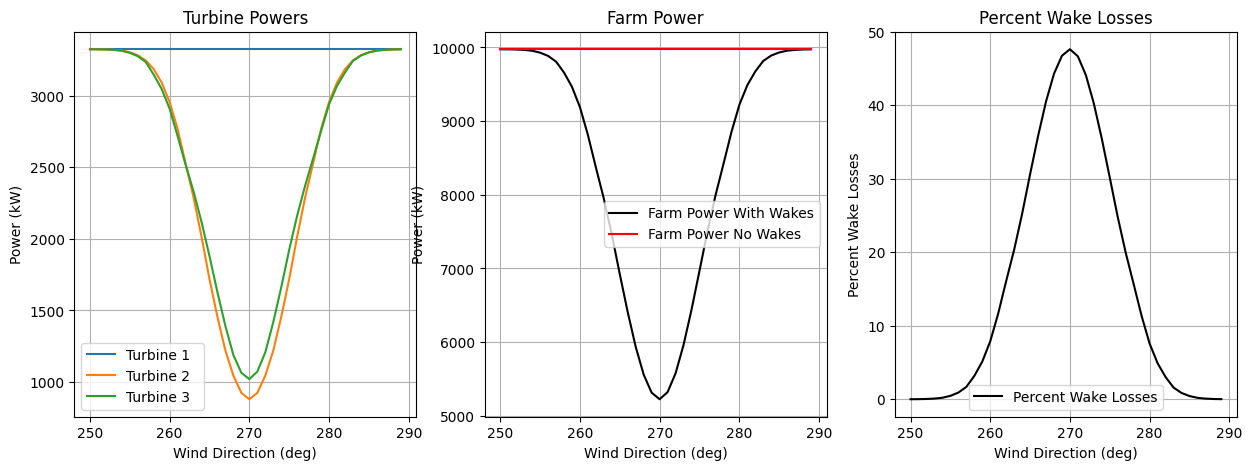
# Plot the results
fig, axarr = plt.subplots(1, 3, figsize=(15, 5))
# Plot the turbine powers
ax = axarr[0]
for i in range(turbine_powers.shape[1]):
ax.plot(wind_directions, turbine_powers[:, i] / 1e3, label=f"Turbine {i+1} ")
ax.set_xlabel("Wind Direction (deg)")
ax.set_ylabel("Power (kW)")
ax.grid(True)
ax.legend()
ax.set_title("Turbine Powers")
# Plot the farm power
ax = axarr[1]
ax.plot(wind_directions, farm_power / 1e3, label="Farm Power With Wakes", color="k")
ax.plot(wind_directions, farm_power_no_wake / 1e3, label="Farm Power No Wakes", color="r")
ax.set_xlabel("Wind Direction (deg)")
ax.set_ylabel("Power (kW)")
ax.grid(True)
ax.legend()
ax.set_title("Farm Power")
# Plot the percent wake losses
ax = axarr[2]
percent_wake_losses = 100 * (farm_power_no_wake - farm_power) / farm_power_no_wake
ax.plot(wind_directions, percent_wake_losses, label="Percent Wake Losses", color="k")
ax.set_xlabel("Wind Direction (deg)")
ax.set_ylabel("Percent Wake Losses")
ax.grid(True)
ax.legend()
ax.set_title("Percent Wake Losses")
######################################################
# Using WindRose
######################################################
# When running FLORIS using a wind rose, that is when a WindRose or WindTIRose object is
# passed into the set function. The functions get_expected_farm_power and get_farm_AEP
# will operate the same as above, however the functions get_turbine_powers and get_farm_power
# will be reshaped from (n_findex, n_turbines) and
# (n_findex) to (n_wind_dir, n_wind_speed, n_turbines)
# and (n_wind_dir, n_wind_speed) respectively. This is make the powers align more easily with the
# provided wind rose.
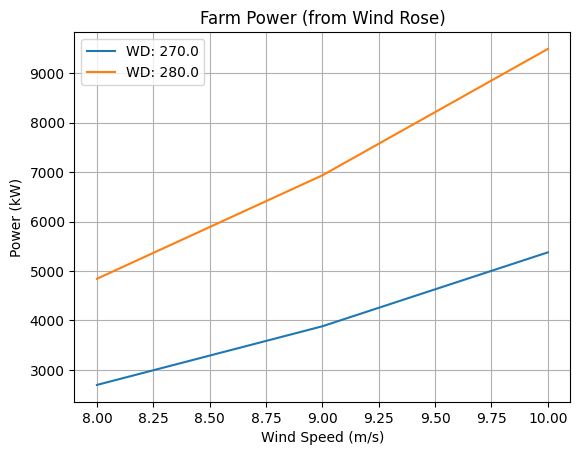
# Declare a WindRose object of 2 wind directions and 3 wind speeds and constant turbulence intensity
wind_rose = WindRose(
wind_directions=np.array([270.0, 280.0]), wind_speeds=np.array([8.0, 9.0, 10.0]), ti_table=0.06
)
fmodel.set(wind_data=wind_rose)
print("==========Wind Rose==========")
print(f"Number of conditions to simulate (2 x 3): {fmodel.n_findex}")
fmodel.run()
turbine_powers = fmodel.get_turbine_powers()
print(f"Shape of turbine powers: {turbine_powers.shape}")
farm_power = fmodel.get_farm_power()
print(f"Shape of farm power: {farm_power.shape}")
# Plot the farm power
fig, ax = plt.subplots()
for w_idx, wd in enumerate(wind_rose.wind_directions):
ax.plot(wind_rose.wind_speeds, farm_power[w_idx, :] / 1e3, label=f"WD: {wd}")
ax.set_xlabel("Wind Speed (m/s)")
ax.set_ylabel("Power (kW)")
ax.grid(True)
ax.legend()
ax.set_title("Farm Power (from Wind Rose)")
plt.show()
import warnings
warnings.filterwarnings('ignore')