"""Example of using the peak-shaving turbine operation model.
This example demonstrates how to use the peak-shaving operation model in FLORIS.
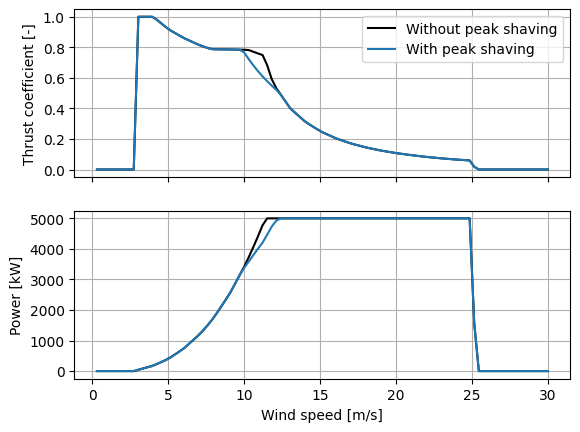
The peak-shaving operation model allows the user to a thrust reduction near rated wind speed to
reduce loads on the turbine. The power is reduced accordingly, and wind turbine wakes
are shallower due to the reduced thrust.
"""
import matplotlib.pyplot as plt
import numpy as np
from floris import FlorisModel, TimeSeries
fmodel = FlorisModel("../inputs/gch.yaml")
fmodel.set(layout_x=[0, 1000.0], layout_y=[0.0, 0.0])
wind_speeds = np.linspace(0, 30, 100)
fmodel.set(
wind_data=TimeSeries(
wind_directions=270 * np.ones_like(wind_speeds),
wind_speeds=wind_speeds,
turbulence_intensities=0.10, # High enough to engage peak shaving
)
)
# Start with "normal" operation under the simple turbine operation model
fmodel.set_operation_model("simple")
fmodel.run()
powers_base = fmodel.get_turbine_powers()/1000
thrust_coefficients_base = fmodel.get_turbine_thrust_coefficients()
# Switch to the peak-shaving operation model
fmodel.set_operation_model("peak-shaving")
fmodel.run()
powers_peak_shaving = fmodel.get_turbine_powers()/1000
thrust_coefficients_peak_shaving = fmodel.get_turbine_thrust_coefficients()
# Compare the power and thrust coefficients of the upstream turbine
fig, ax = plt.subplots(2,1,sharex=True)
ax[0].plot(
wind_speeds,
thrust_coefficients_base[:,0],
label="Without peak shaving",
color="black"
)
ax[0].plot(
wind_speeds,
thrust_coefficients_peak_shaving[:,0],
label="With peak shaving",
color="C0"
)
ax[1].plot(
wind_speeds,
powers_base[:,0],
label="Without peak shaving",
color="black"
)
ax[1].plot(
wind_speeds,
powers_peak_shaving[:,0],
label="With peak shaving",
color="C0"
)
ax[1].grid()
ax[0].grid()
ax[0].legend()
ax[0].set_ylabel("Thrust coefficient [-]")
ax[1].set_xlabel("Wind speed [m/s]")
ax[1].set_ylabel("Power [kW]")
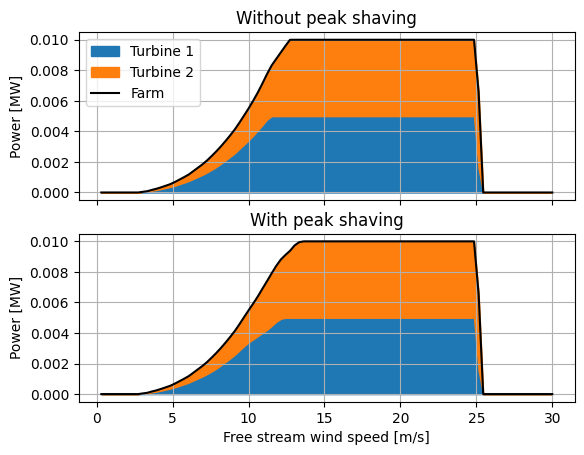
# Look at the total power across the two turbines for each case
fig, ax = plt.subplots(2,1,sharex=True,sharey=True)
ax[0].fill_between(
wind_speeds,
0,
powers_base[:, 0]/1e6,
color='C0',
label='Turbine 1'
)
ax[0].fill_between(
wind_speeds,
powers_base[:, 0]/1e6,
powers_base[:, :2].sum(axis=1)/1e6,
color='C1',
label='Turbine 2'
)
ax[0].plot(
wind_speeds,
powers_base[:,:2].sum(axis=1)/1e6,
color='k',
label='Farm'
)
ax[1].fill_between(
wind_speeds,
0,
powers_peak_shaving[:, 0]/1e6,
color='C0',
label='Turbine 1'
)
ax[1].fill_between(
wind_speeds,
powers_peak_shaving[:, 0]/1e6,
powers_peak_shaving[:, :2].sum(axis=1)/1e6,
color='C1',
label='Turbine 2'
)
ax[1].plot(
wind_speeds,
powers_peak_shaving[:,:2].sum(axis=1)/1e6,
color='k',
label='Farm'
)
ax[0].legend()
ax[0].set_title("Without peak shaving")
ax[1].set_title("With peak shaving")
ax[0].set_ylabel("Power [MW]")
ax[1].set_ylabel("Power [MW]")
ax[0].grid()
ax[1].grid()
ax[1].set_xlabel("Free stream wind speed [m/s]")
plt.show()
import warnings
warnings.filterwarnings('ignore')