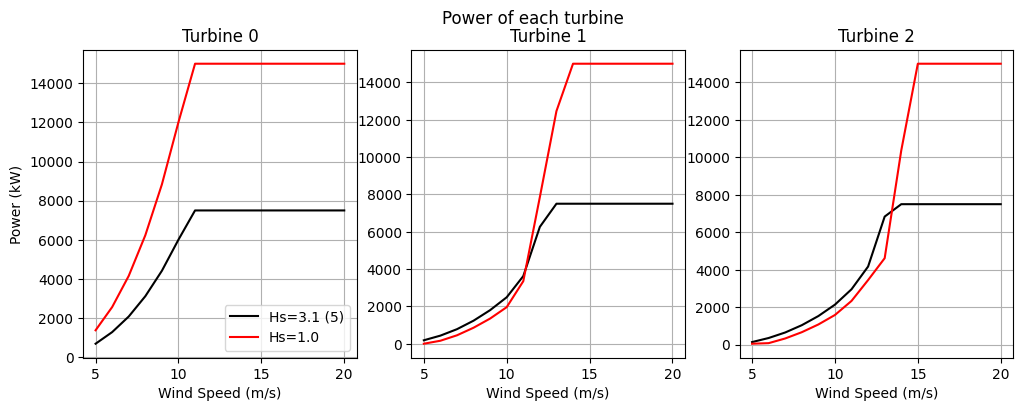
"""Example: Multi-dimensional power/thrust coefficient with 2 Hs values
This example follows the previous example but shows the effect of changing the Hs setting.

Updated in FLORIS v4.6 to use new array-based multidimensional functionality, where a different
multidimensional condition can be specified for each findex. Prior to v4.6, when only scalar
multidimensional conditions were supported, this example used two separate FLORIS runs to compute
the two Hs cases.

NOTE: The multi-dimensional power/thrust coefficient data used in this example is fictional for the
purposes of facilitating this example. The power/thrust coefficient values for the different wave
conditions are scaled values of the original power/thrust coefficient data for the IEA 15MW turbine.
"""


import matplotlib.pyplot as plt
import numpy as np

from floris import FlorisModel, TimeSeries


# Initialize FLORIS with the given input file.
fmodel = FlorisModel("../inputs/gch_multi_dim_cp_ct.yaml")
fmodel.set(layout_x=[0.0, 500.0, 1000.0], layout_y=[0.0, 0.0, 0.0])

# Conditions to evaluate
n_wind_speeds = 16
wind_speeds = np.tile(np.linspace(5, 20, n_wind_speeds), 2) # Sweep wind speeds
multidim_conditions = {
    "Tp": np.array([2.5]*n_wind_speeds*2),
    "Hs": np.array([3.1]*n_wind_speeds + [1.0]*n_wind_speeds),
}
time_series = TimeSeries(
    wind_directions=270.0,
    wind_speeds=wind_speeds,
    turbulence_intensities=0.06,
    multidim_conditions=multidim_conditions
)

# Set wind, multidim conditios onto the FlorisModel
fmodel.set(wind_data=time_series)

# Calculate wakes
fmodel.run()

# Collect the turbine powers in kW
turbine_powers = fmodel.get_turbine_powers() / 1000.0

# Plot the power in each case and the difference in power
fig, axarr = plt.subplots(1, 3, sharex=True, figsize=(12, 4))

for t_idx in range(3):
    ax = axarr[t_idx]
    ax.plot(
        wind_speeds[:n_wind_speeds],
        turbine_powers[:n_wind_speeds, t_idx],
        color="k",
        label="Hs=3.1 (5)"
    )
    ax.plot(
        wind_speeds[n_wind_speeds:],
        turbine_powers[n_wind_speeds:, t_idx],
        color="r",
        label="Hs=1.0"
    )
    ax.grid(True)
    ax.set_xlabel("Wind Speed (m/s)")
    ax.set_title(f"Turbine {t_idx}")

axarr[0].set_ylabel("Power (kW)")
axarr[0].legend()
fig.suptitle("Power of each turbine")

plt.show()
import warnings
warnings.filterwarnings('ignore')