"""Example: Heterogeneous Inflow using wind data
When multiple cases are considered, the heterogeneous inflow conditions can be defined in two ways:
1. Passing heterogeneous_inflow_config to the set method, with P points,
and speed_multipliers of size n_findex X P
2. More conveniently, building a HeterogeneousMap object that defines the speed_multipliers as a
function of wind direction and/or wind speed and passing that to a WindData object. When
the WindData object is passed to the set method, the heterogeneous_inflow_config is
automatically generated for each findex by finding the nearest wind direction and/or wind
speed in the HeterogeneousMap object.
This example:
1) Implements heterogeneous inflow for a 4 turbine layout using both of the above methods
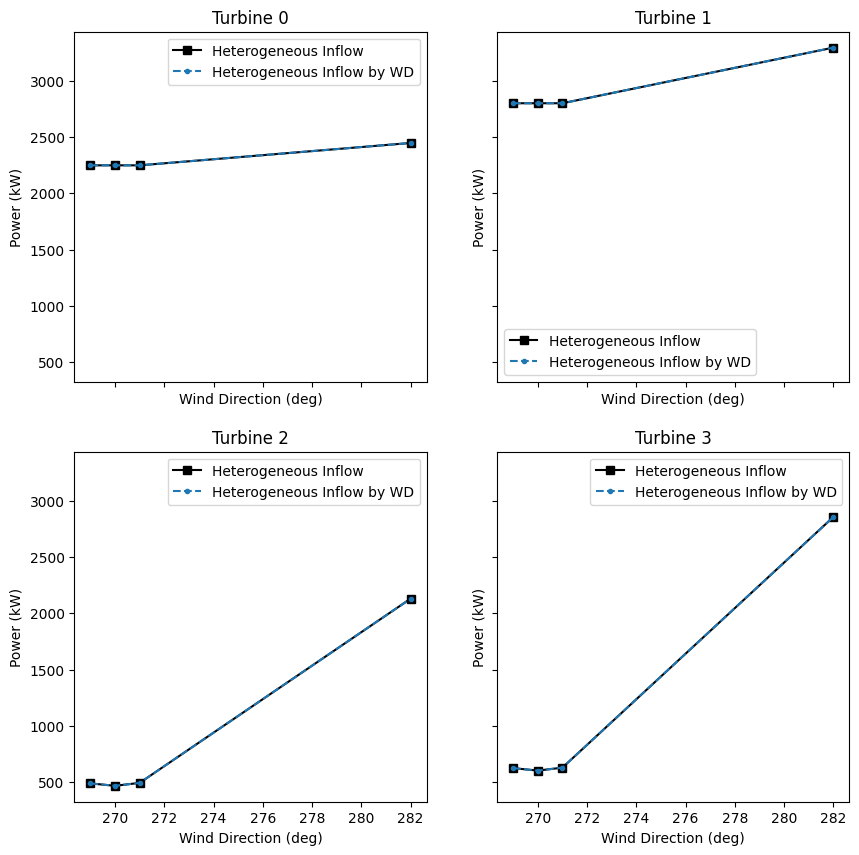
2) Compares the results of the two methods and shows that they are equivalent
"""
import matplotlib.pyplot as plt
import numpy as np
from floris import (
FlorisModel,
HeterogeneousMap,
TimeSeries,
)
# Initialize FlorisModel
fmodel = FlorisModel("../inputs/gch.yaml")
# Change the layout to a 4 turbine layout in a box
fmodel.set(layout_x=[0, 0, 500.0, 500.0], layout_y=[0, 500.0, 0, 500.0])
# Define a TimeSeries object with 4 wind directions and constant wind speed
# and turbulence intensity
time_series = TimeSeries(
wind_directions=np.array([269.0, 270.0, 271.0, 282.0]),
wind_speeds=8.0,
turbulence_intensities=0.06,
)
# Apply the time series to the FlorisModel
fmodel.set(wind_data=time_series)
# Define the x_locs to be used in the heterogeneous inflow configuration that form
# a box around the turbines
x_locs = [-500.0, -500.0, 1000.0, 1000.0]
y_locs = [-500.0, 1000.0, -500.0, 1000.0]
# Assume the speed-ups are defined such that they are the same 265-275 degrees and 275-285 degrees
# If defining heterogeneous_inflow_config directly, then the speed_multipliers are of size
# n_findex x P, where the first 3 rows are identical and the last row is different
speed_multipliers = [
[1.0, 1.25, 1.0, 1.25],
[1.0, 1.25, 1.0, 1.25],
[1.0, 1.25, 1.0, 1.25],
[1.0, 1.35, 1.0, 1.35],
]
heterogeneous_inflow_config = {
"speed_multipliers": speed_multipliers,
"x": x_locs,
"y": y_locs,
}
# Set the heterogeneous inflow configuration
fmodel.set(heterogeneous_inflow_config=heterogeneous_inflow_config)
# Run the FLORIS simulation
fmodel.run()
# Get the power output of the turbines
turbine_powers = fmodel.get_turbine_powers() / 1000.0
# Now repeat using the wind_data object and HeterogeneousMap object
# First, create the speed multipliers for the two wind directions
speed_multipliers = [[1.0, 1.25, 1.0, 1.25], [1.0, 1.35, 1.0, 1.35]]
# Now define the HeterogeneousMap object
heterogeneous_map = HeterogeneousMap(
x=x_locs,
y=y_locs,
speed_multipliers=speed_multipliers,
wind_directions=[270.0, 280.0],
)
# Print the HeterogeneousMap object
print(heterogeneous_map)
# Now create a new TimeSeries object including the heterogeneous_inflow_config_by_wd
time_series = TimeSeries(
wind_directions=np.array([269.0, 270.0, 271.0, 282.0]),
wind_speeds=8.0,
turbulence_intensities=0.06,
heterogeneous_map=heterogeneous_map,
)
# Note that previously, the a heterogeneous_inflow_config_by_wd, which only only
# specification by wind direction was defined, and for backwards compatibility,
# this is still accepted. However, the HeterogeneousMap object is more flexible.
# The following code produces the same results as the previous code block.
heterogeneous_inflow_config_by_wd = {
"speed_multipliers": speed_multipliers,
"x": x_locs,
"y": y_locs,
"wind_directions": [270.0, 280.0],
}
time_series = TimeSeries(
wind_directions=np.array([269.0, 270.0, 271.0, 282.0]),
wind_speeds=8.0,
turbulence_intensities=0.06,
heterogeneous_inflow_config_by_wd=heterogeneous_inflow_config_by_wd,
)
# Apply the time series to the FlorisModel
fmodel.set(wind_data=time_series)
# Run the FLORIS simulation
fmodel.run()
# Get the power output of the turbines
turbine_powers_by_wd = fmodel.get_turbine_powers() / 1000.0
# Plot the results
wind_directions = fmodel.wind_directions
fig, axarr = plt.subplots(2, 2, sharex=True, sharey=True, figsize=(10, 10))
axarr = axarr.flatten()
for tindex in range(4):
ax = axarr[tindex]
ax.plot(wind_directions, turbine_powers[:, tindex], "ks-", label="Heterogeneous Inflow")
ax.plot(
wind_directions, turbine_powers_by_wd[:, tindex], ".--", label="Heterogeneous Inflow by WD"
)
ax.set_title(f"Turbine {tindex}")
ax.set_xlabel("Wind Direction (deg)")
ax.set_ylabel("Power (kW)")
ax.legend()
plt.show()
import warnings
warnings.filterwarnings('ignore')