"""Example: Disabling turbines

This example is adapted from https://github.com/NREL/floris/pull/693
contributed by Elie Kadoche.

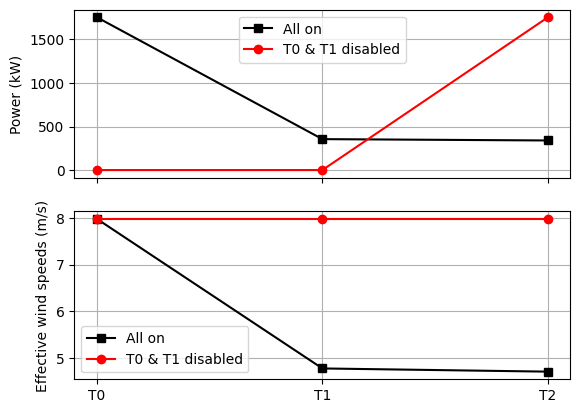
This example demonstrates the ability of FLORIS to shut down some turbines
during a simulation.
"""

import matplotlib.pyplot as plt
import numpy as np

from floris import FlorisModel


# Initialize FLORIS
fmodel = FlorisModel("../inputs/gch.yaml")

# Change to the mixed model turbine
# (Note this could also be done with the simple-derating model)
fmodel.set_operation_model("mixed")

# Consider a wind farm of 3 aligned wind turbines
layout = np.array([[0.0, 0.0], [500.0, 0.0], [1000.0, 0.0]])

# Run the computations for 2 identical wind data
# (n_findex = 2)
wind_directions = np.array([270.0, 270.0])
wind_speeds = np.array([8.0, 8.0])
turbulence_intensities = np.array([0.06, 0.06])

# Shut down the first 2 turbines for the second findex
# 2 findex x 3 turbines
disable_turbines = np.array([[False, False, False], [True, True, False]])

# Simulation
# ------------------------------------------

# Reinitialize flow field
fmodel.set(
    layout_x=layout[:, 0],
    layout_y=layout[:, 1],
    wind_directions=wind_directions,
    wind_speeds=wind_speeds,
    turbulence_intensities=turbulence_intensities,
    disable_turbines=disable_turbines,
)

# # Compute wakes
fmodel.run()

# Results
# ------------------------------------------

# Get powers and effective wind speeds
turbine_powers = fmodel.get_turbine_powers()
turbine_powers = np.round(turbine_powers * 1e-3, decimals=2)
effective_wind_speeds = fmodel.turbine_average_velocities


# Plot the results
fig, axarr = plt.subplots(2, 1, sharex=True)

# Plot the power
ax = axarr[0]
ax.plot(["T0", "T1", "T2"], turbine_powers[0, :], "ks-", label="All on")
ax.plot(["T0", "T1", "T2"], turbine_powers[1, :], "ro-", label="T0 & T1 disabled")
ax.set_ylabel("Power (kW)")
ax.grid(True)
ax.legend()

ax = axarr[1]
ax.plot(["T0", "T1", "T2"], effective_wind_speeds[0, :], "ks-", label="All on")
ax.plot(["T0", "T1", "T2"], effective_wind_speeds[1, :], "ro-", label="T0 & T1 disabled")
ax.set_ylabel("Effective wind speeds (m/s)")
ax.grid(True)
ax.legend()

plt.show()
import warnings
warnings.filterwarnings('ignore')

