"""Example: Multi-dimensional power/thrust coefficients with turbulence intensity
This example follows the previous example, but demonstrating how a multidimensional turbine can be
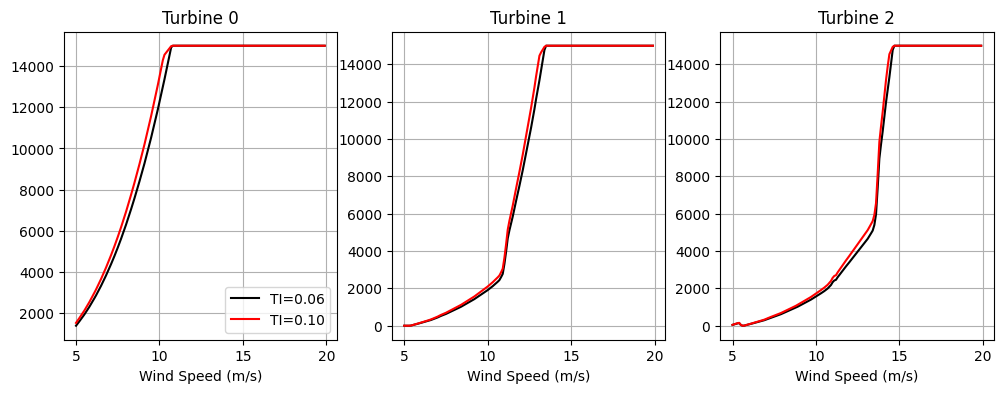
used to model the effect of turbulence intensity on power and thrust coefficient.
Updated in FLORIS v4.6 to demonstrate new array-based multidimensional functionality. In the updated
version, setting loop_over_ti to True will run a single scalar multidimensional condition at a time
and call fmodel.run() multiple times, similar to the behavior prior to v4.6. Alternatively, users
may set loop_over_ti to False to use the new (and improved!) functionality and run all TI values in
a single call to fmodel.run().
NOTE: The multi-dimensional power/thrust coefficient data used in this example is fictional for the
purposes of facilitating this example and the power values shown should not be taken as
representative of the actual effect of turbulence intensity on power/thrust coefficient.
"""
import matplotlib.pyplot as plt
import numpy as np
from floris import FlorisModel, TimeSeries
# Initialize FLORIS with the given input file.
fmodel = FlorisModel("../inputs/gch_multi_dim_cp_ct_TI.yaml")
# Set both cases to 3 turbine layout
fmodel.set(layout_x=[0.0, 500.0, 1000.0], layout_y=[0.0, 0.0, 0.0])
loop_over_ti = True # Otherwise, will set all TIs at once.
# Use a sweep of wind speeds
wind_speeds = np.arange(5, 20, 0.1)
if loop_over_ti:
# In this case, we will run() the fmodel multiple times, one for each turbulence intensity.
# We set a scalar multidim_conditions, which is broadcast over the wind speeds.
time_series = TimeSeries(
wind_directions=270.0, wind_speeds=wind_speeds, turbulence_intensities=0.06
)
fmodel.set(wind_data=time_series)
# Loop over different turbulence intensities using set()
# When running with TI=0.10, the multidimensional data handler will find the nearest defined
# value of 0.08 and use that data.
fig, axarr = plt.subplots(1, 3, sharex=True, figsize=(12, 4))
for ti, col in zip([0.06, 0.10], ["k", "r"]):
fmodel.set(multidim_conditions={"TI": ti})
fmodel.run()
turbine_powers = fmodel.get_turbine_powers() / 1000.0
for t_idx in range(3):
ax = axarr[t_idx]
ax.plot(wind_speeds, turbine_powers[:, t_idx], color=col, label="TI={0:.2f}".format(ti))
else:
# Set all conditions to evaluate at once, and call fmodel.run() only once.
# We set multidim_conditions to be arrays matching the number of findices of the fmodel.
# Note that turbulence_intensities on the TimeSeries object is _not_ linked to the
# multidim_conditions
time_series = TimeSeries(
wind_directions=270.0,
wind_speeds=np.tile(wind_speeds, 2),
turbulence_intensities=0.06, # This value will be used for wake calculations only
multidim_conditions={"TI": np.array([0.06]*len(wind_speeds) + [0.10]*len(wind_speeds))},
)
fmodel.set(wind_data=time_series)
fmodel.run()
turbine_powers = fmodel.get_turbine_powers() / 1000.0
fig, axarr = plt.subplots(1, 3, sharex=True, figsize=(12, 4))
for t_idx in range(3):
ax = axarr[t_idx]
ax.plot(wind_speeds, turbine_powers[:len(wind_speeds), t_idx], color="k", label="TI=0.06")
ax.plot(wind_speeds, turbine_powers[len(wind_speeds):, t_idx], color="r", label="TI=0.10")
# Plot aesthetics
for t_idx in range(3):
axarr[t_idx].grid(True)
axarr[t_idx].set_xlabel("Wind Speed (m/s)")
axarr[t_idx].set_title(f"Turbine {t_idx}")
axarr[0].legend()
plt.show()
import warnings
warnings.filterwarnings('ignore')