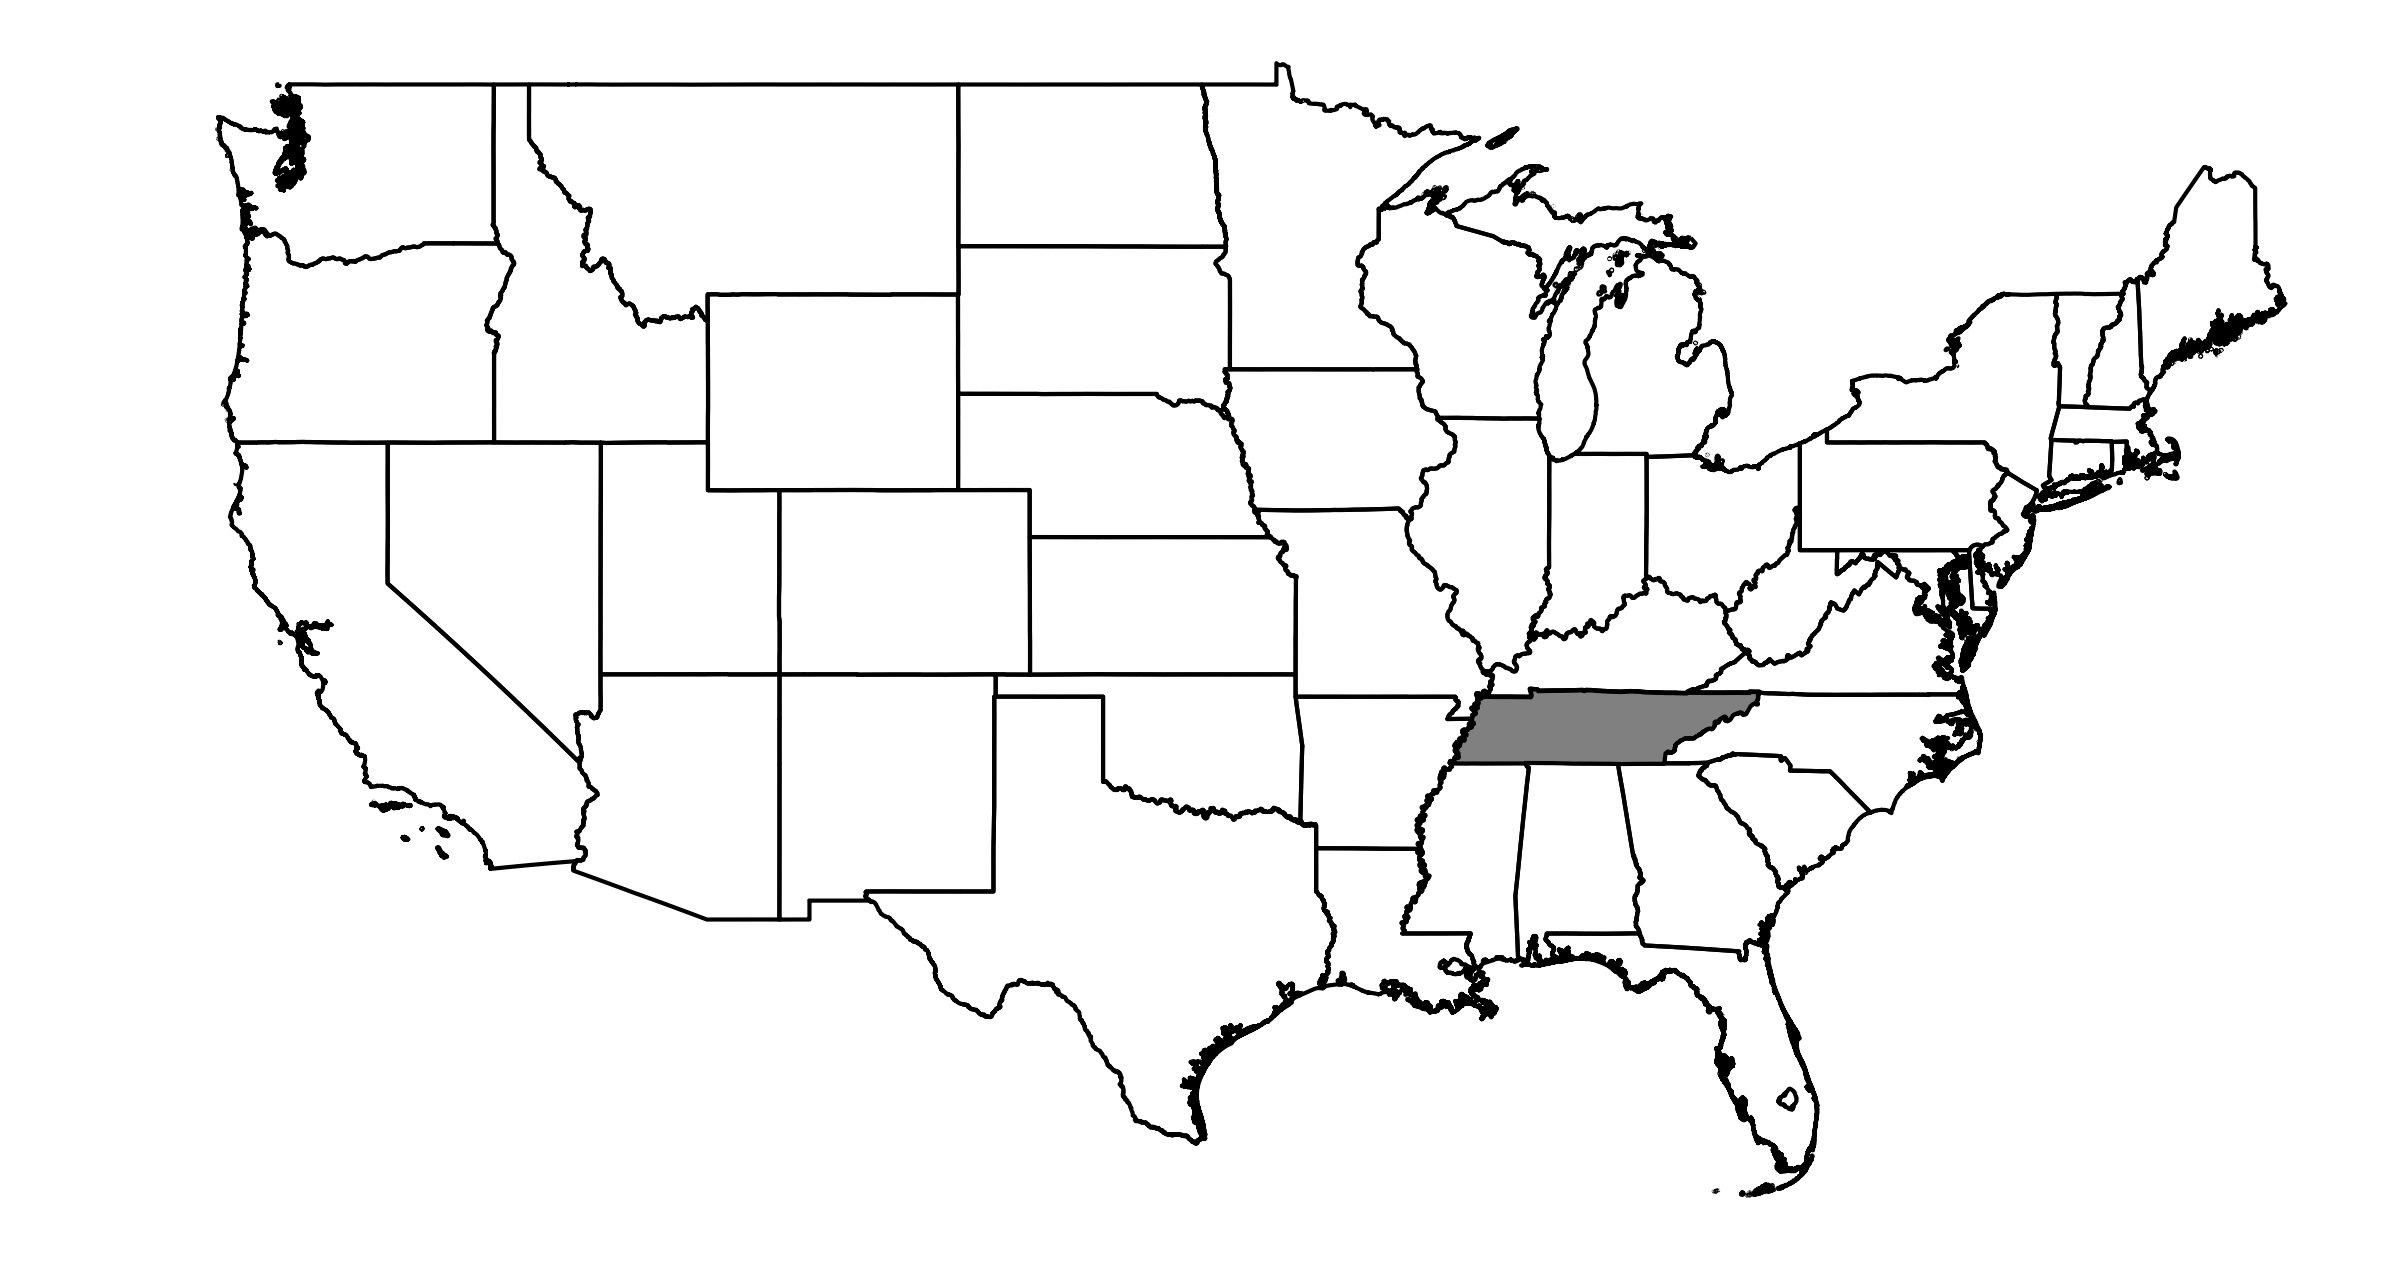
Utility Partner TVA
Map of Utility Partner TVA

Note that we used a simple state mask, and the region will not perfectly match the true Utility boundary.
GCM Historical Skill Summary (1980-2019)
| GFDL-CM4 | TaiESM1 | EC-Earth3-Veg | NorESM2-MM | EC-Earth3-CC | EC-Earth3 | MPI-ESM1-2-HR | CESM2-WACCM | MRI-ESM2-0 | CESM2 | GFDL-ESM4 | INM-CM5-0 | INM-CM4-8 | |
|---|---|---|---|---|---|---|---|---|---|---|---|---|---|
| T2M KS | 0.042 | 0.030 | 0.046 | 0.053 | 0.052 | 0.052 | 0.056 | 0.039 | 0.057 | 0.035 | 0.052 | 0.054 | 0.063 |
| T2M Bias P50 (°C) | -2.455 | -0.528 | -1.814 | 1.613 | -1.511 | -2.074 | -1.500 | 1.774 | -1.359 | 1.755 | -3.207 | -0.984 | -0.284 |
| T2M Max KS | 0.032 | 0.057 | 0.060 | 0.055 | 0.064 | 0.061 | 0.047 | 0.038 | 0.057 | 0.067 | 0.063 | 0.073 | 0.087 |
| T2M Max Bias P95 (°C) | -2.072 | -0.015 | 0.126 | 3.031 | 0.859 | 0.024 | -2.332 | -3.423 | -0.021 | 3.210 | -2.480 | 3.821 | 5.550 |
| T2M Min KS | 0.048 | 0.028 | 0.030 | 0.047 | 0.036 | 0.038 | 0.060 | 0.028 | 0.063 | 0.073 | 0.041 | 0.063 | 0.045 |
| T2M Min Bias P5 (°C) | -2.809 | -2.918 | -1.779 | 1.011 | -1.959 | -2.937 | -2.890 | 5.603 | 0.254 | 1.528 | -1.003 | 2.727 | 2.371 |
| RH2M KS | 0.063 | 0.074 | 0.071 | 0.097 | 0.071 | 0.065 | 0.076 | 0.085 | 0.061 | 0.094 | 0.187 | 0.136 | 0.153 |
| RH2M Bias P50 (%) | 9.751 | 8.965 | 10.444 | -10.596 | 10.138 | 10.429 | 17.615 | -6.225 | 5.223 | -6.829 | 22.547 | -0.717 | -4.531 |
| RH2M Max KS | 0.214 | nan | 0.111 | nan | 0.107 | 0.110 | 0.135 | nan | 0.248 | nan | nan | 0.307 | 0.324 |
| RH2M Max Bias P95 (%) | 2.561 | nan | 0.398 | nan | 0.358 | 0.450 | 4.619 | nan | 0.665 | nan | nan | 2.967 | 2.981 |
| RH2M Min KS | 0.082 | nan | 0.074 | nan | 0.073 | 0.066 | 0.064 | nan | 0.057 | nan | nan | 0.105 | 0.110 |
| RH2M Min Bias P5 (%) | 17.885 | nan | 18.362 | nan | 18.180 | 20.613 | 34.711 | nan | 18.212 | nan | nan | -16.244 | -19.627 |
| PR KS | 0.086 | 0.076 | 0.090 | 0.070 | 0.089 | 0.093 | 0.085 | 0.084 | 0.074 | 0.083 | 0.124 | 0.118 | 0.100 |
| PR Bias P50 (%) | 5.902 | 4.607 | 6.884 | 3.413 | 6.769 | 7.212 | 5.380 | 6.134 | 5.953 | 5.791 | 13.783 | 13.807 | 9.508 |
| GHI KS | 0.019 | 0.031 | 0.036 | 0.032 | 0.041 | 0.035 | 0.057 | 0.030 | 0.044 | 0.028 | 0.031 | 0.028 | 0.037 |
| GHI Bias P50 (%) | -1.591 | -3.945 | -4.788 | 9.652 | -6.875 | -5.860 | -4.005 | 0.026 | 7.116 | 1.742 | -11.531 | 7.341 | 10.124 |
| WS 100m KS | 0.051 | 0.062 | 0.075 | 0.123 | 0.073 | 0.069 | 0.120 | 0.313 | 0.162 | 0.313 | 0.054 | 0.254 | 0.263 |
| WS 100m Bias P50 (%) | -12.413 | -22.051 | 1.110 | 4.051 | 1.853 | -19.491 | -7.991 | 64.571 | -48.630 | 64.472 | -23.603 | -72.270 | -73.274 |
| Process Skill | 0.062 | 0.291 | 0.056 | 0.041 | 0.045 | 0.062 | 0.089 | 0.161 | 0.343 | 0.205 | 0.143 | 0.819 | 0.851 |
GCM Changes from 1980-2019 to 2050-2059
All of the following plots are interactive. Try hovering your mouse over data points, clicking and dragging, scrolling, and double clicking on the legends.