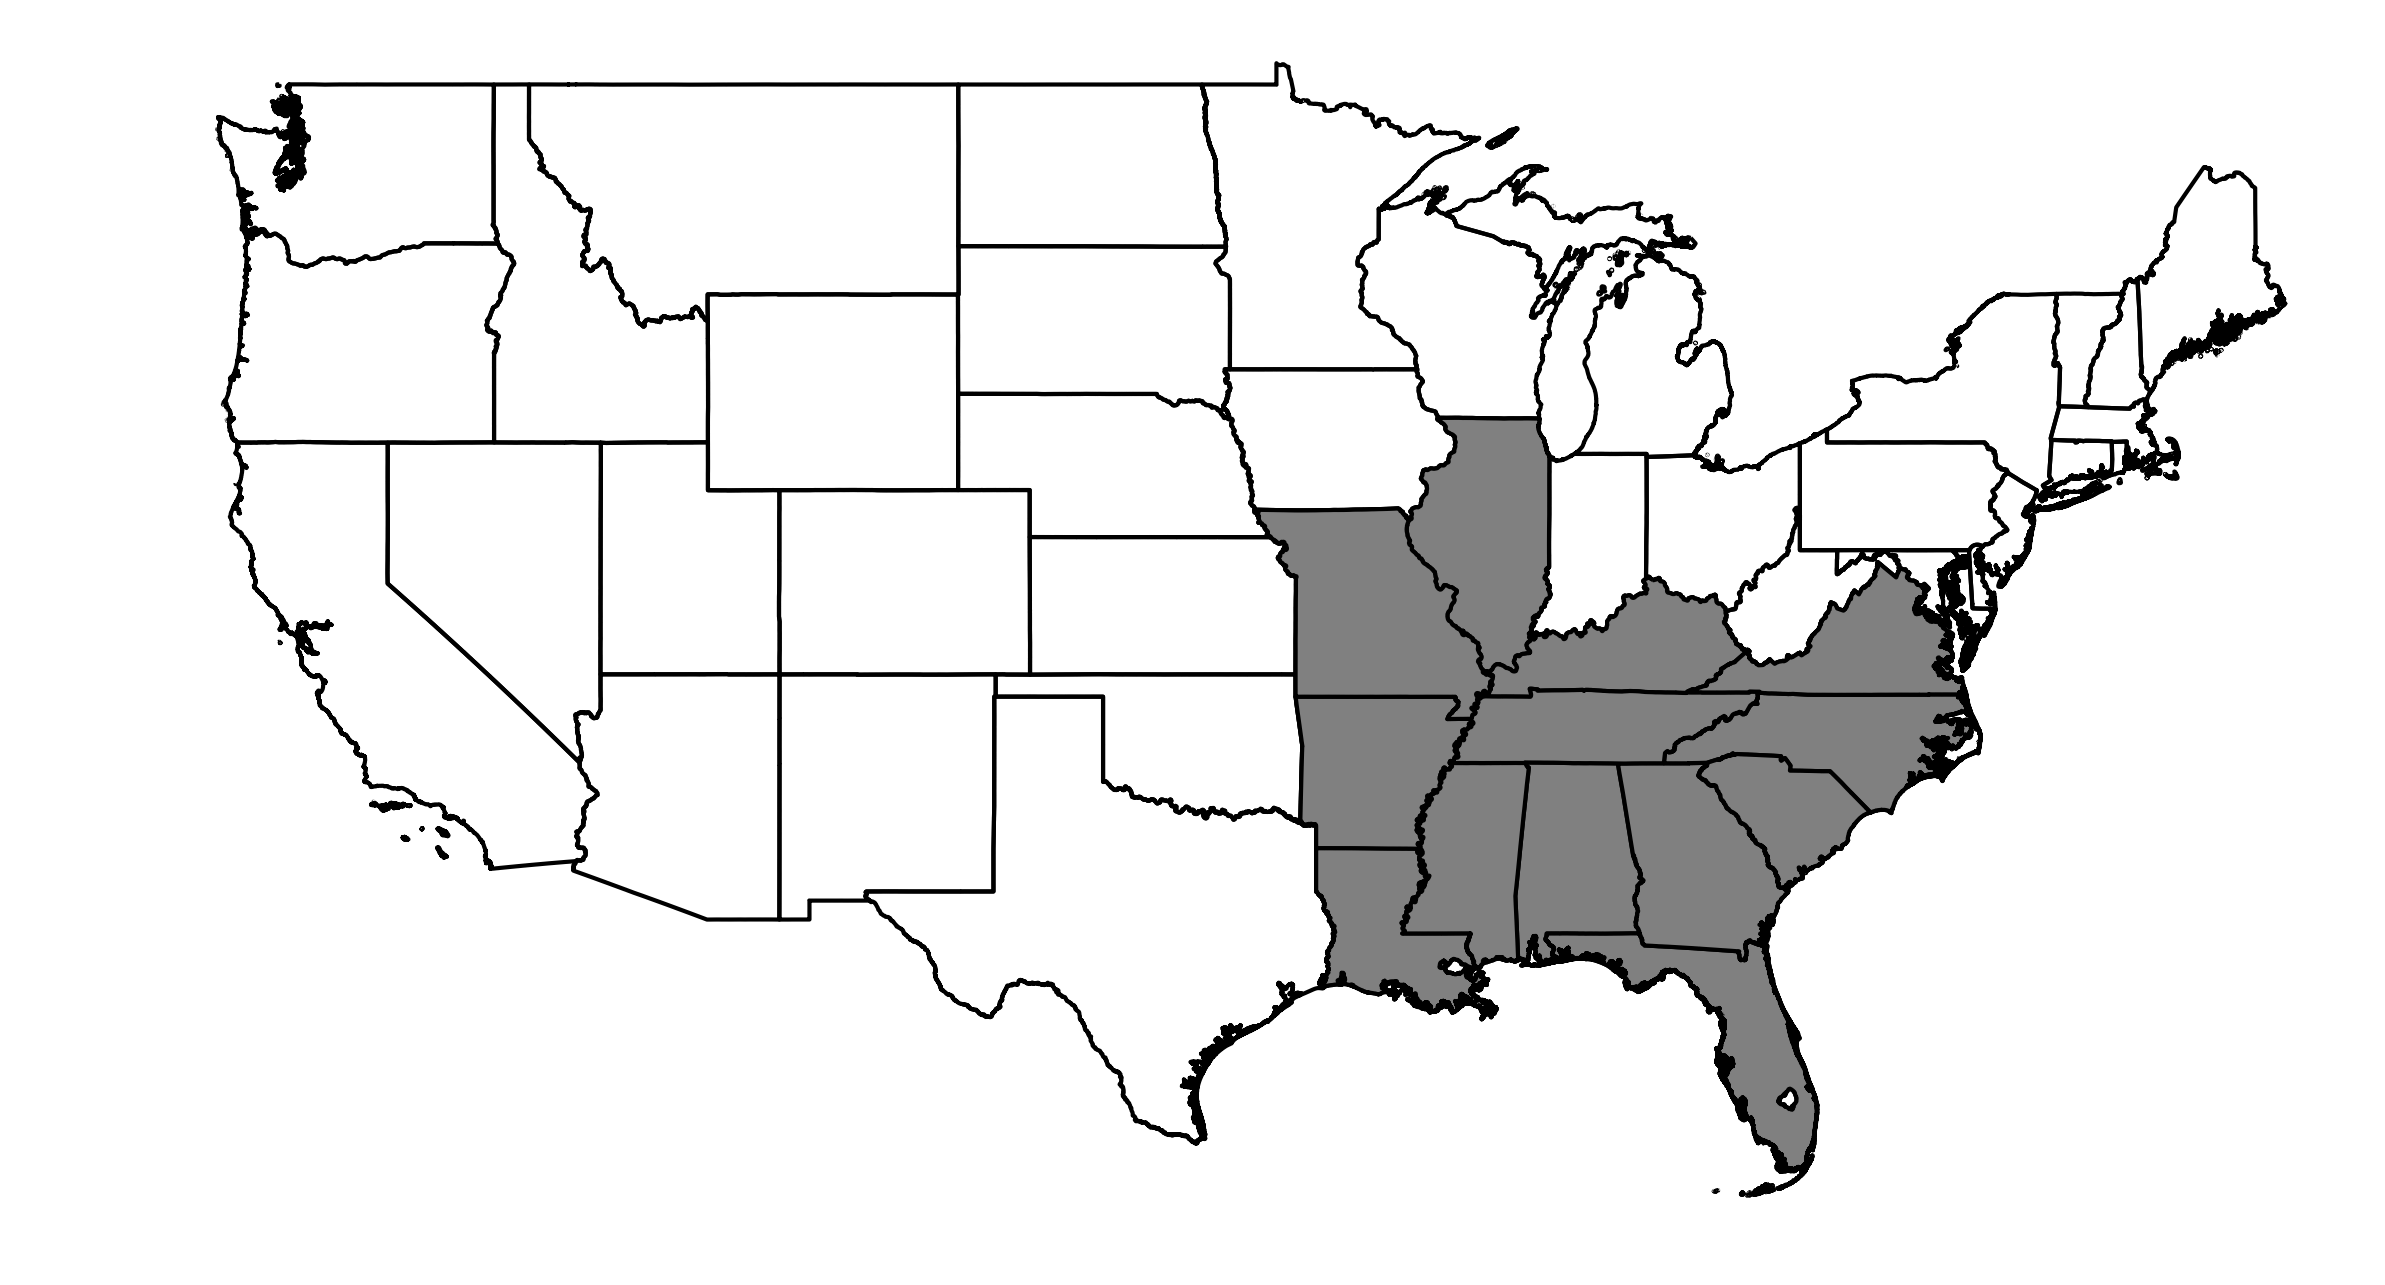
NERC Region SERC
Map of NERC Region SERC

Note that we used a simple state mask, and the region may not perfectly match the spatial boundary of the true NERC region.
GCM Historical Skill Summary (1980-2019)
| GFDL-CM4 | EC-Earth3-Veg | EC-Earth3-CC | EC-Earth3 | TaiESM1 | MPI-ESM1-2-HR | NorESM2-MM | MRI-ESM2-0 | CESM2-WACCM | CESM2 | GFDL-ESM4 | INM-CM5-0 | INM-CM4-8 | |
|---|---|---|---|---|---|---|---|---|---|---|---|---|---|
| T2M KS | 0.045 | 0.045 | 0.047 | 0.048 | 0.029 | 0.056 | 0.052 | 0.055 | 0.045 | 0.042 | 0.061 | 0.077 | 0.077 |
| T2M Bias P50 (°C) | -2.045 | -1.238 | -1.019 | -1.514 | -0.145 | -0.857 | 1.748 | -0.749 | 2.116 | 2.094 | -2.583 | -0.591 | 0.110 |
| T2M Max KS | 0.037 | 0.057 | 0.059 | 0.057 | 0.050 | 0.047 | 0.053 | 0.052 | 0.049 | 0.062 | 0.058 | 0.092 | 0.096 |
| T2M Max Bias P95 (°C) | -1.522 | 0.336 | 0.709 | 0.006 | 0.859 | -1.402 | 2.949 | -0.088 | -2.914 | 3.345 | -1.723 | 1.752 | 3.128 |
| T2M Min KS | 0.048 | 0.041 | 0.043 | 0.046 | 0.030 | 0.052 | 0.051 | 0.055 | 0.070 | 0.068 | 0.057 | 0.091 | 0.076 |
| T2M Min Bias P5 (°C) | -1.917 | -1.532 | -1.695 | -2.715 | -1.764 | -1.722 | 0.784 | 0.851 | 6.503 | 2.134 | -0.978 | 3.184 | 3.033 |
| RH2M KS | 0.055 | 0.066 | 0.065 | 0.060 | 0.063 | 0.076 | 0.090 | 0.068 | 0.084 | 0.087 | 0.133 | 0.131 | 0.141 |
| RH2M Bias P50 (%) | 7.431 | 7.626 | 7.685 | 7.890 | 5.989 | 8.445 | -11.734 | 0.642 | -8.529 | -9.186 | 17.600 | -0.367 | -3.077 |
| RH2M Max KS | 0.149 | 0.100 | 0.097 | 0.095 | nan | 0.175 | nan | 0.229 | nan | nan | nan | 0.279 | 0.294 |
| RH2M Max Bias P95 (%) | 2.608 | 0.342 | 0.331 | 0.416 | nan | 3.735 | nan | 0.507 | nan | nan | nan | 2.663 | 2.624 |
| RH2M Min KS | 0.067 | 0.068 | 0.066 | 0.060 | nan | 0.067 | nan | 0.053 | nan | nan | nan | 0.115 | 0.121 |
| RH2M Min Bias P5 (%) | 6.654 | 11.595 | 12.024 | 14.264 | nan | 18.062 | nan | 13.986 | nan | nan | nan | -15.055 | -18.143 |
| PR KS | 0.088 | 0.091 | 0.091 | 0.095 | 0.091 | 0.081 | 0.081 | 0.074 | 0.094 | 0.091 | 0.110 | 0.137 | 0.124 |
| PR Bias P50 (%) | 3.182 | 1.545 | 1.570 | 1.610 | 3.957 | 1.823 | 2.621 | 3.240 | 4.235 | 3.879 | 6.114 | 21.128 | 17.973 |
| GHI KS | 0.021 | 0.034 | 0.038 | 0.033 | 0.038 | 0.051 | 0.035 | 0.038 | 0.031 | 0.032 | 0.024 | 0.027 | 0.032 |
| GHI Bias P50 (%) | -1.335 | -3.038 | -5.057 | -3.573 | -3.338 | -0.498 | 8.687 | 8.772 | 1.157 | 2.339 | -7.102 | 6.019 | 8.391 |
| WS 100m KS | 0.046 | 0.075 | 0.075 | 0.059 | 0.054 | 0.091 | 0.115 | 0.148 | 0.264 | 0.263 | 0.076 | 0.206 | 0.211 |
| WS 100m Bias P50 (%) | -20.246 | -0.627 | -0.237 | -17.528 | -20.403 | -13.309 | 3.062 | -50.170 | 44.408 | 45.006 | -13.263 | -55.950 | -56.509 |
| Process Skill | 0.062 | 0.056 | 0.045 | 0.062 | 0.291 | 0.089 | 0.041 | 0.343 | 0.161 | 0.205 | 0.143 | 0.819 | 0.851 |
GCM Changes from 1980-2019 to 2050-2059
All of the following plots are interactive. Try hovering your mouse over data points, clicking and dragging, scrolling, and double clicking on the legends.