Documentation: Linaro Performance Reports
Linaro Performance Reports is a low-overhead tool that produces one-page text and HTML reports summarizing and characterizing both scalar and MPI application performance. (Only ~5% application slowdown even with thousands of MPI processes.) These high-level reports can help answer:
- Is this application optimized for the system it is running on?
- Does it benefit from running at this scale?
- Are there I/O or networking bottlenecks affecting performance?
- Which configuration changes can be made to improve performance further?
Walk through
Here we show the information you can obtain with Linaro Performance reports using VASP as an example. In the next section, we will detail how to obtain these reports. If you need help with profiling your programs, reach out to HPC help and we can work with you.
Here is the header of performance report obtained for a VASP run on 1 node with 36 processes:
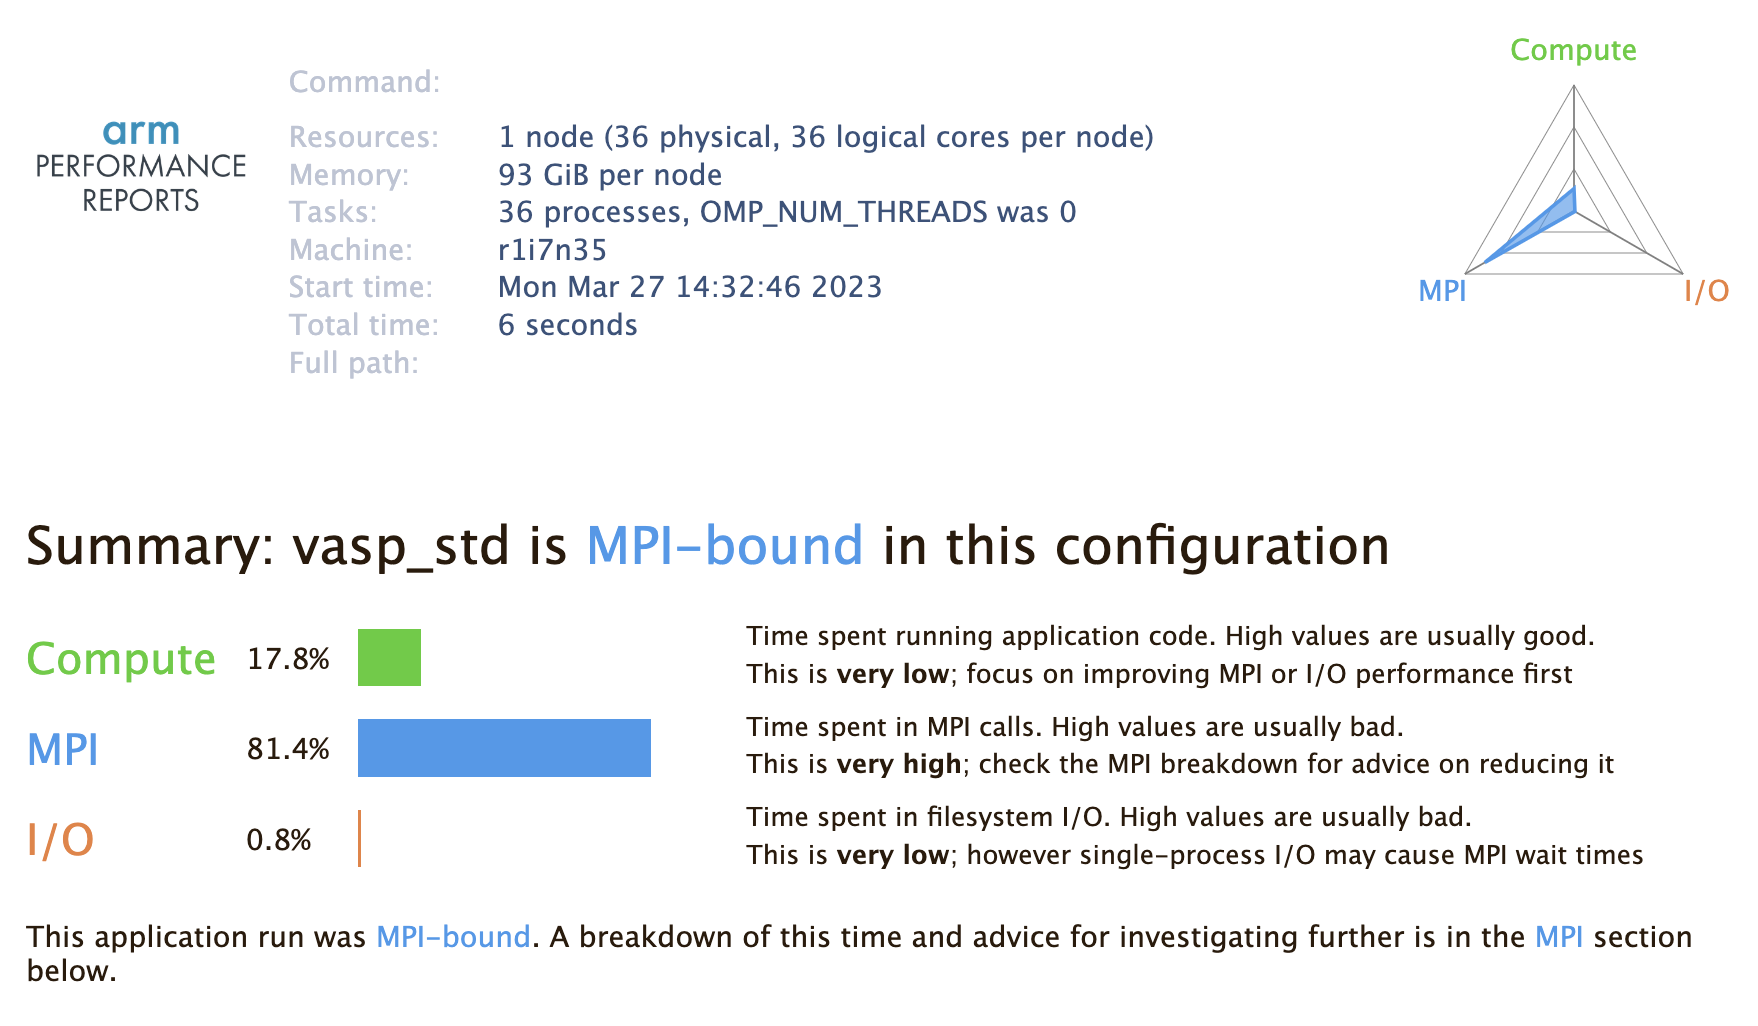
This shows time spent running application code, sending MPI calls, and time on I/O. In this case, we see that we are MPI-bound, which makes sense given that we are running a small, simple test case on more MPI tasks than necessary, which creates unnecssary MPI communication overhead.
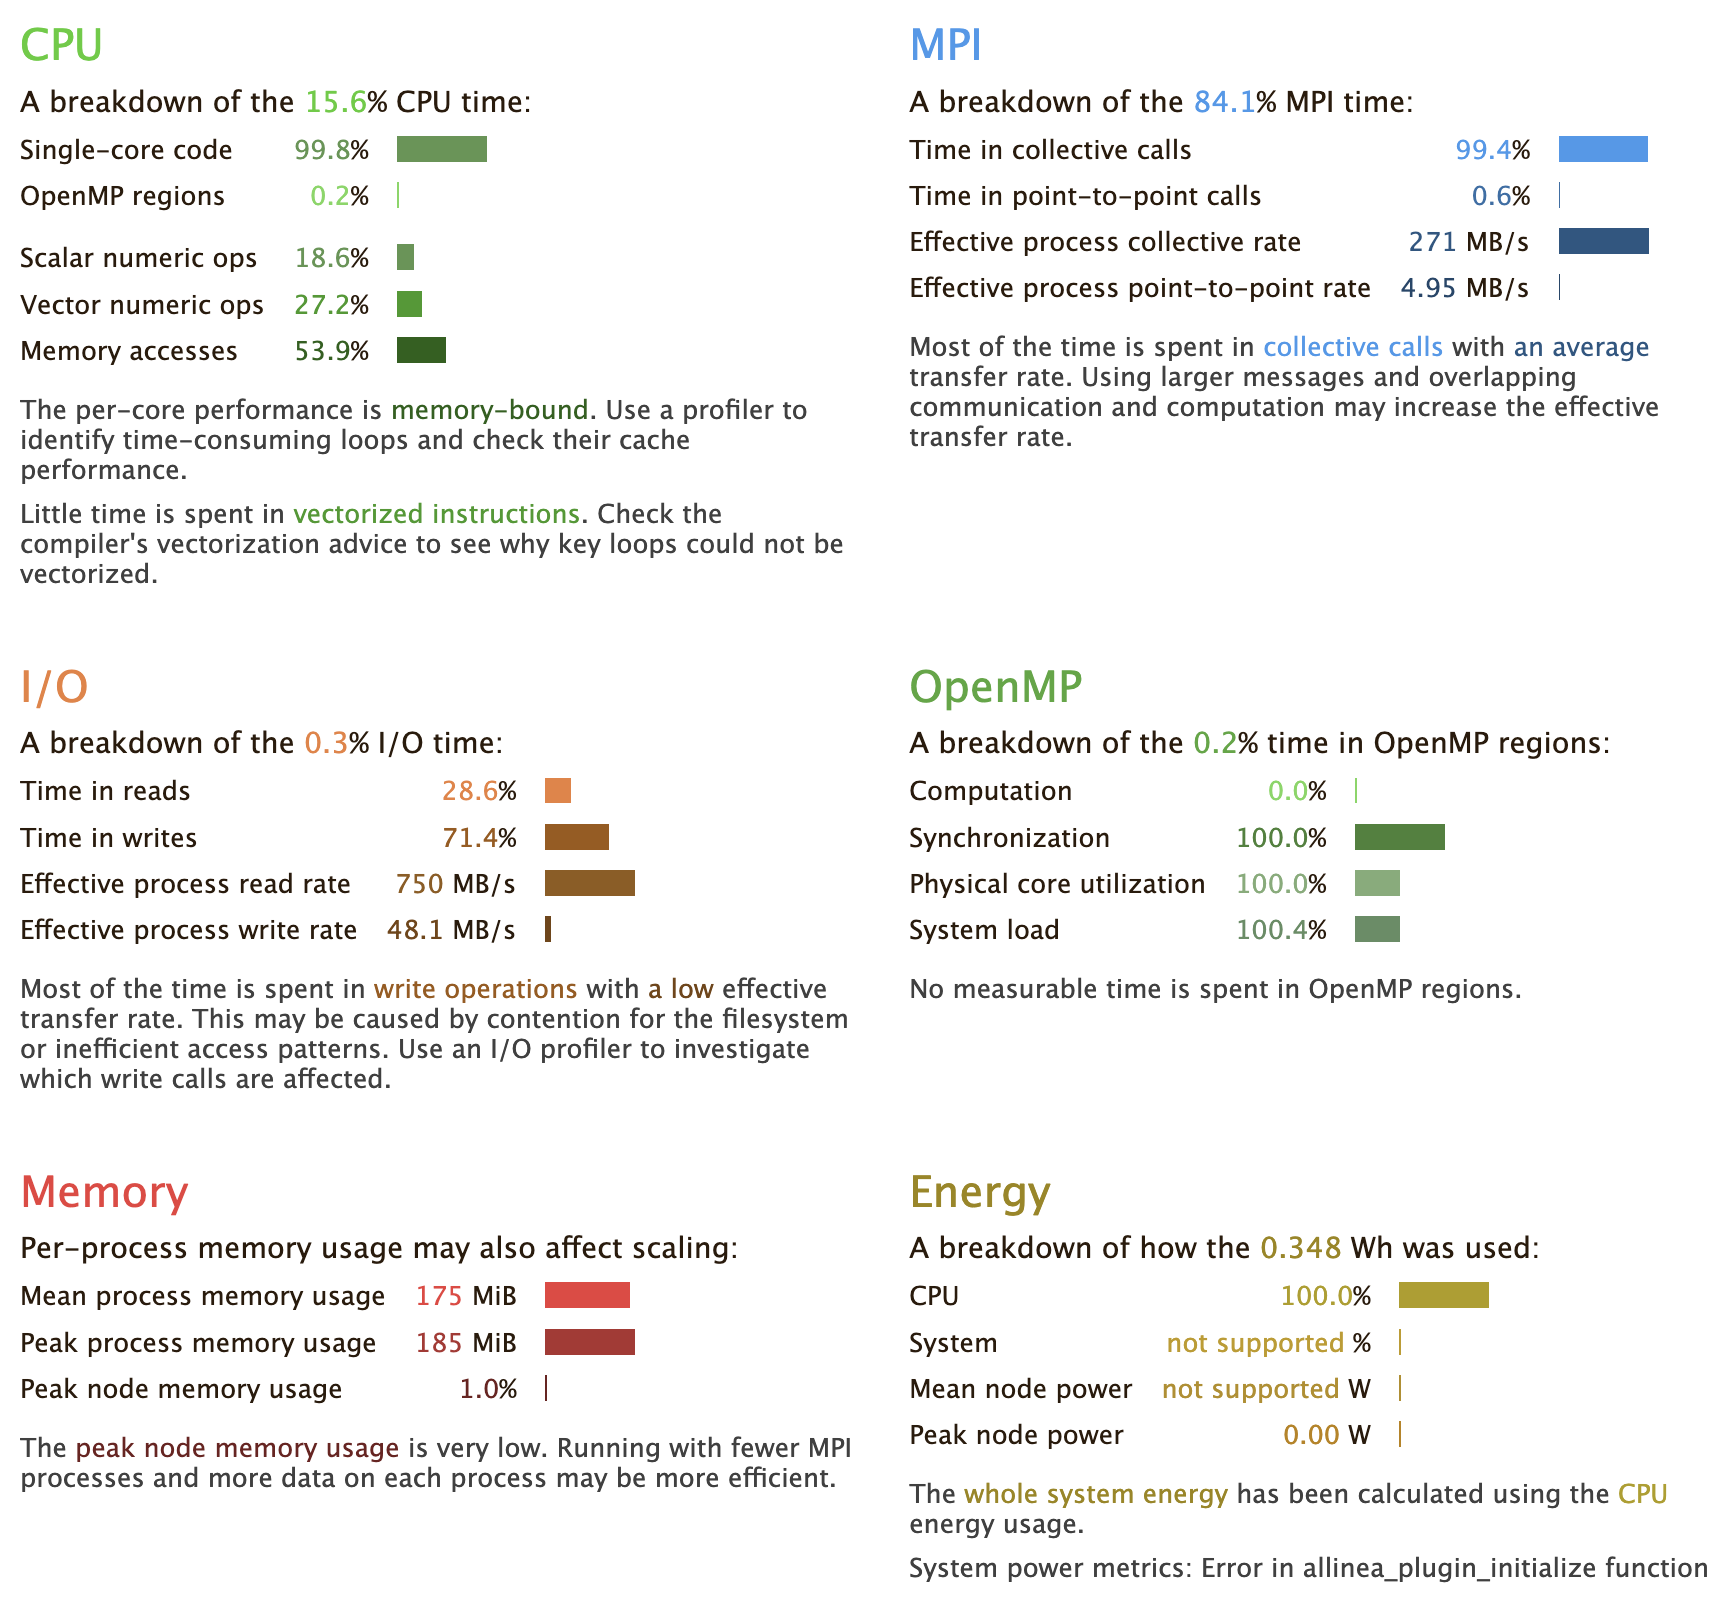
The rest of the report shows a further breakdown of each of these categories:
All you need to do is load the module and prefix your execution command with perf-report:
- Start an interactive job session. Use the debug or other partitions as appropriate:
$ salloc --nodes=<N> --time=<time> --account=<handle>
- Load the linaro-forge module (formerly arm), and additionally load any other modules needed to run your program:
$ module load linaro-forge
$ module load mkl intel-mpi #for VASP
- Set MPI parameters and run your exe using
perf-report:
$ perf-report srun -n 36 PATH/TO/YOUR/PROGRAM/exe
This will generate an .html file and a .txt file that you can view in a browser or text editor. You should now see the overview we described in the previous section.