Linaro MAP
Documentation: Linaro Forge Documentation Page
Linaro MAP (Memory Access Profiler) is a tool that provides insight into how memory is being accessed by an application. It can help developers understand the memory access patterns of an application and identify performance issues caused by memory bottlenecks. Linaro MAP can profile code running on multiple cores as well as code running on a system with hardware accelerators, such as GPUs, allowing developers to identify memory access patterns specific to these accelerators. The profiling data generated by Linaro MAP can be visualized in a variety of ways, including call graphs, heat maps, and histograms, making it easy to identify patterns and potential bottlenecks. The tool can also generate reports that provide a summary of memory usage and access patterns, as well as recommendations for optimizing memory usage. Here we will go through some of the information you can obtain with Linaro MAP using VASP as an example and in the next section MAP we show how to start up such a MAP profile. If you need help with profiling your programs, reach out to HPC help and we can work with you.
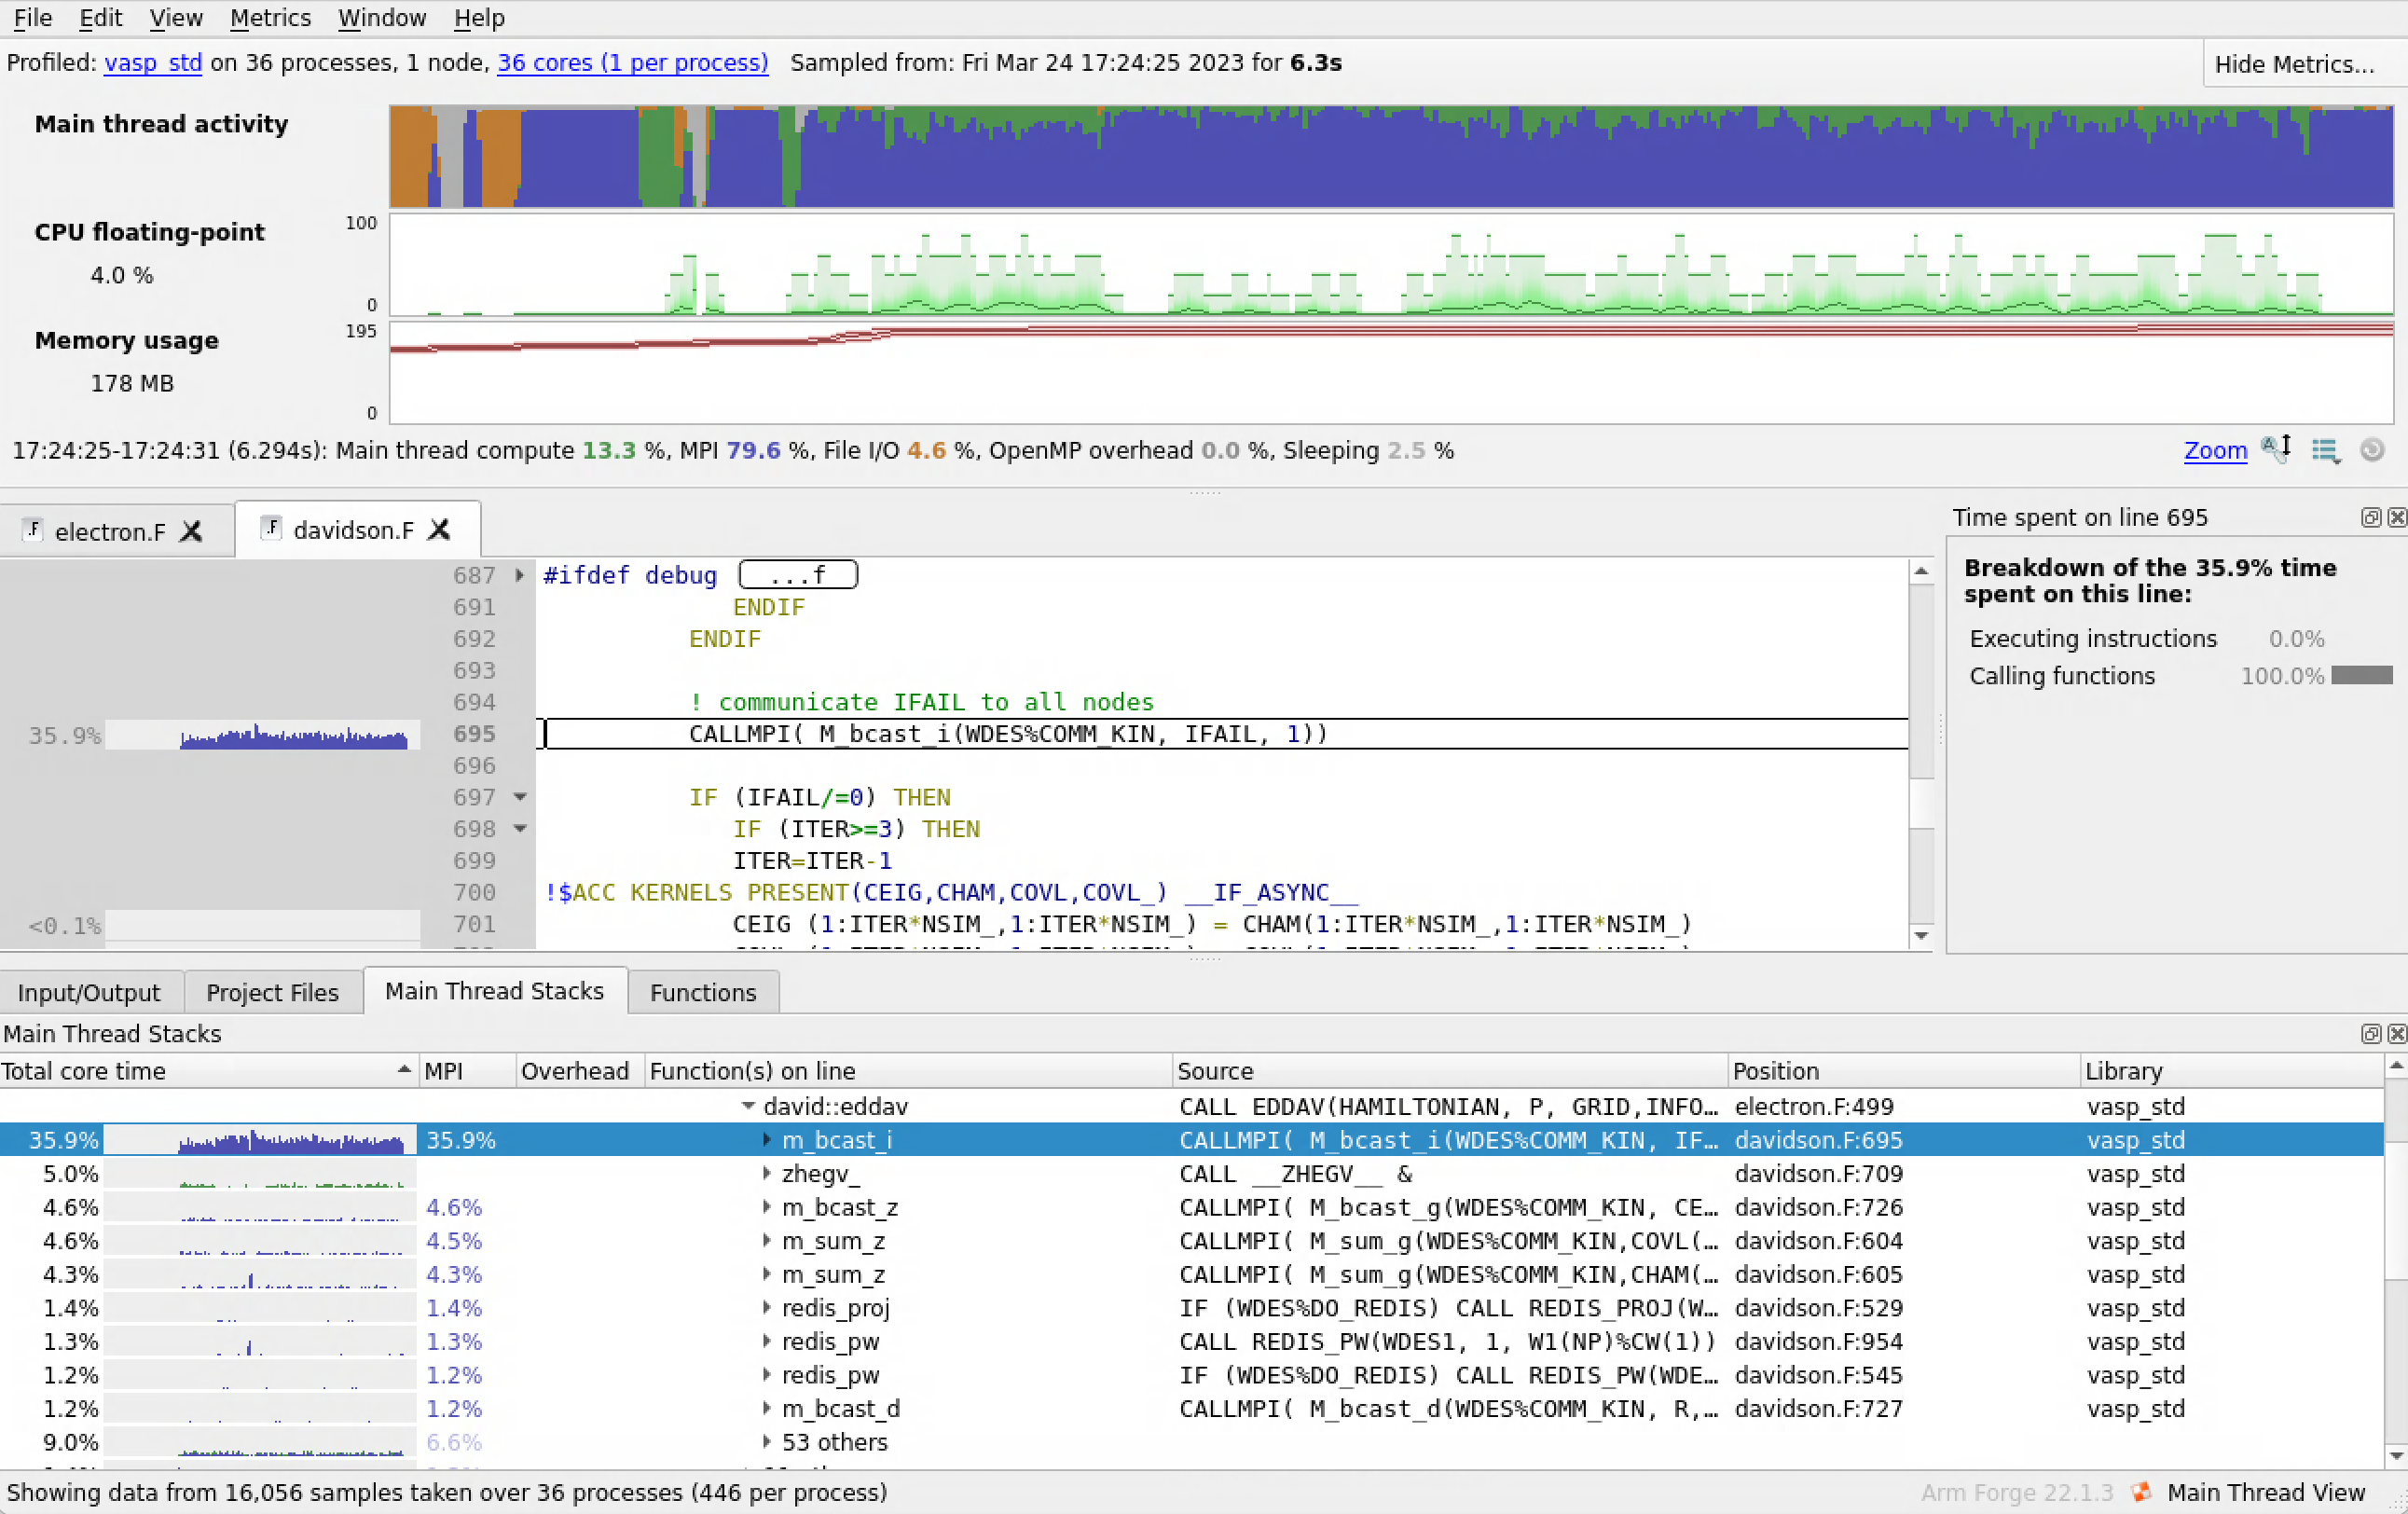
Here is some profiling information obtained for VASP.
Across the top we see our metrics data for the default metrics: main thread activity, percent time each rank spends on floating-point instructions, and memory usage. The horizontal axis is wall clock time. The colors represent the following:
- 🟢 Green: Single-threaded computation time.
- 🔵 Blue: MPI communication and waiting time.
- 🟠 Orange: I/O time
- 🟣 Dark purple: Accelerator time.
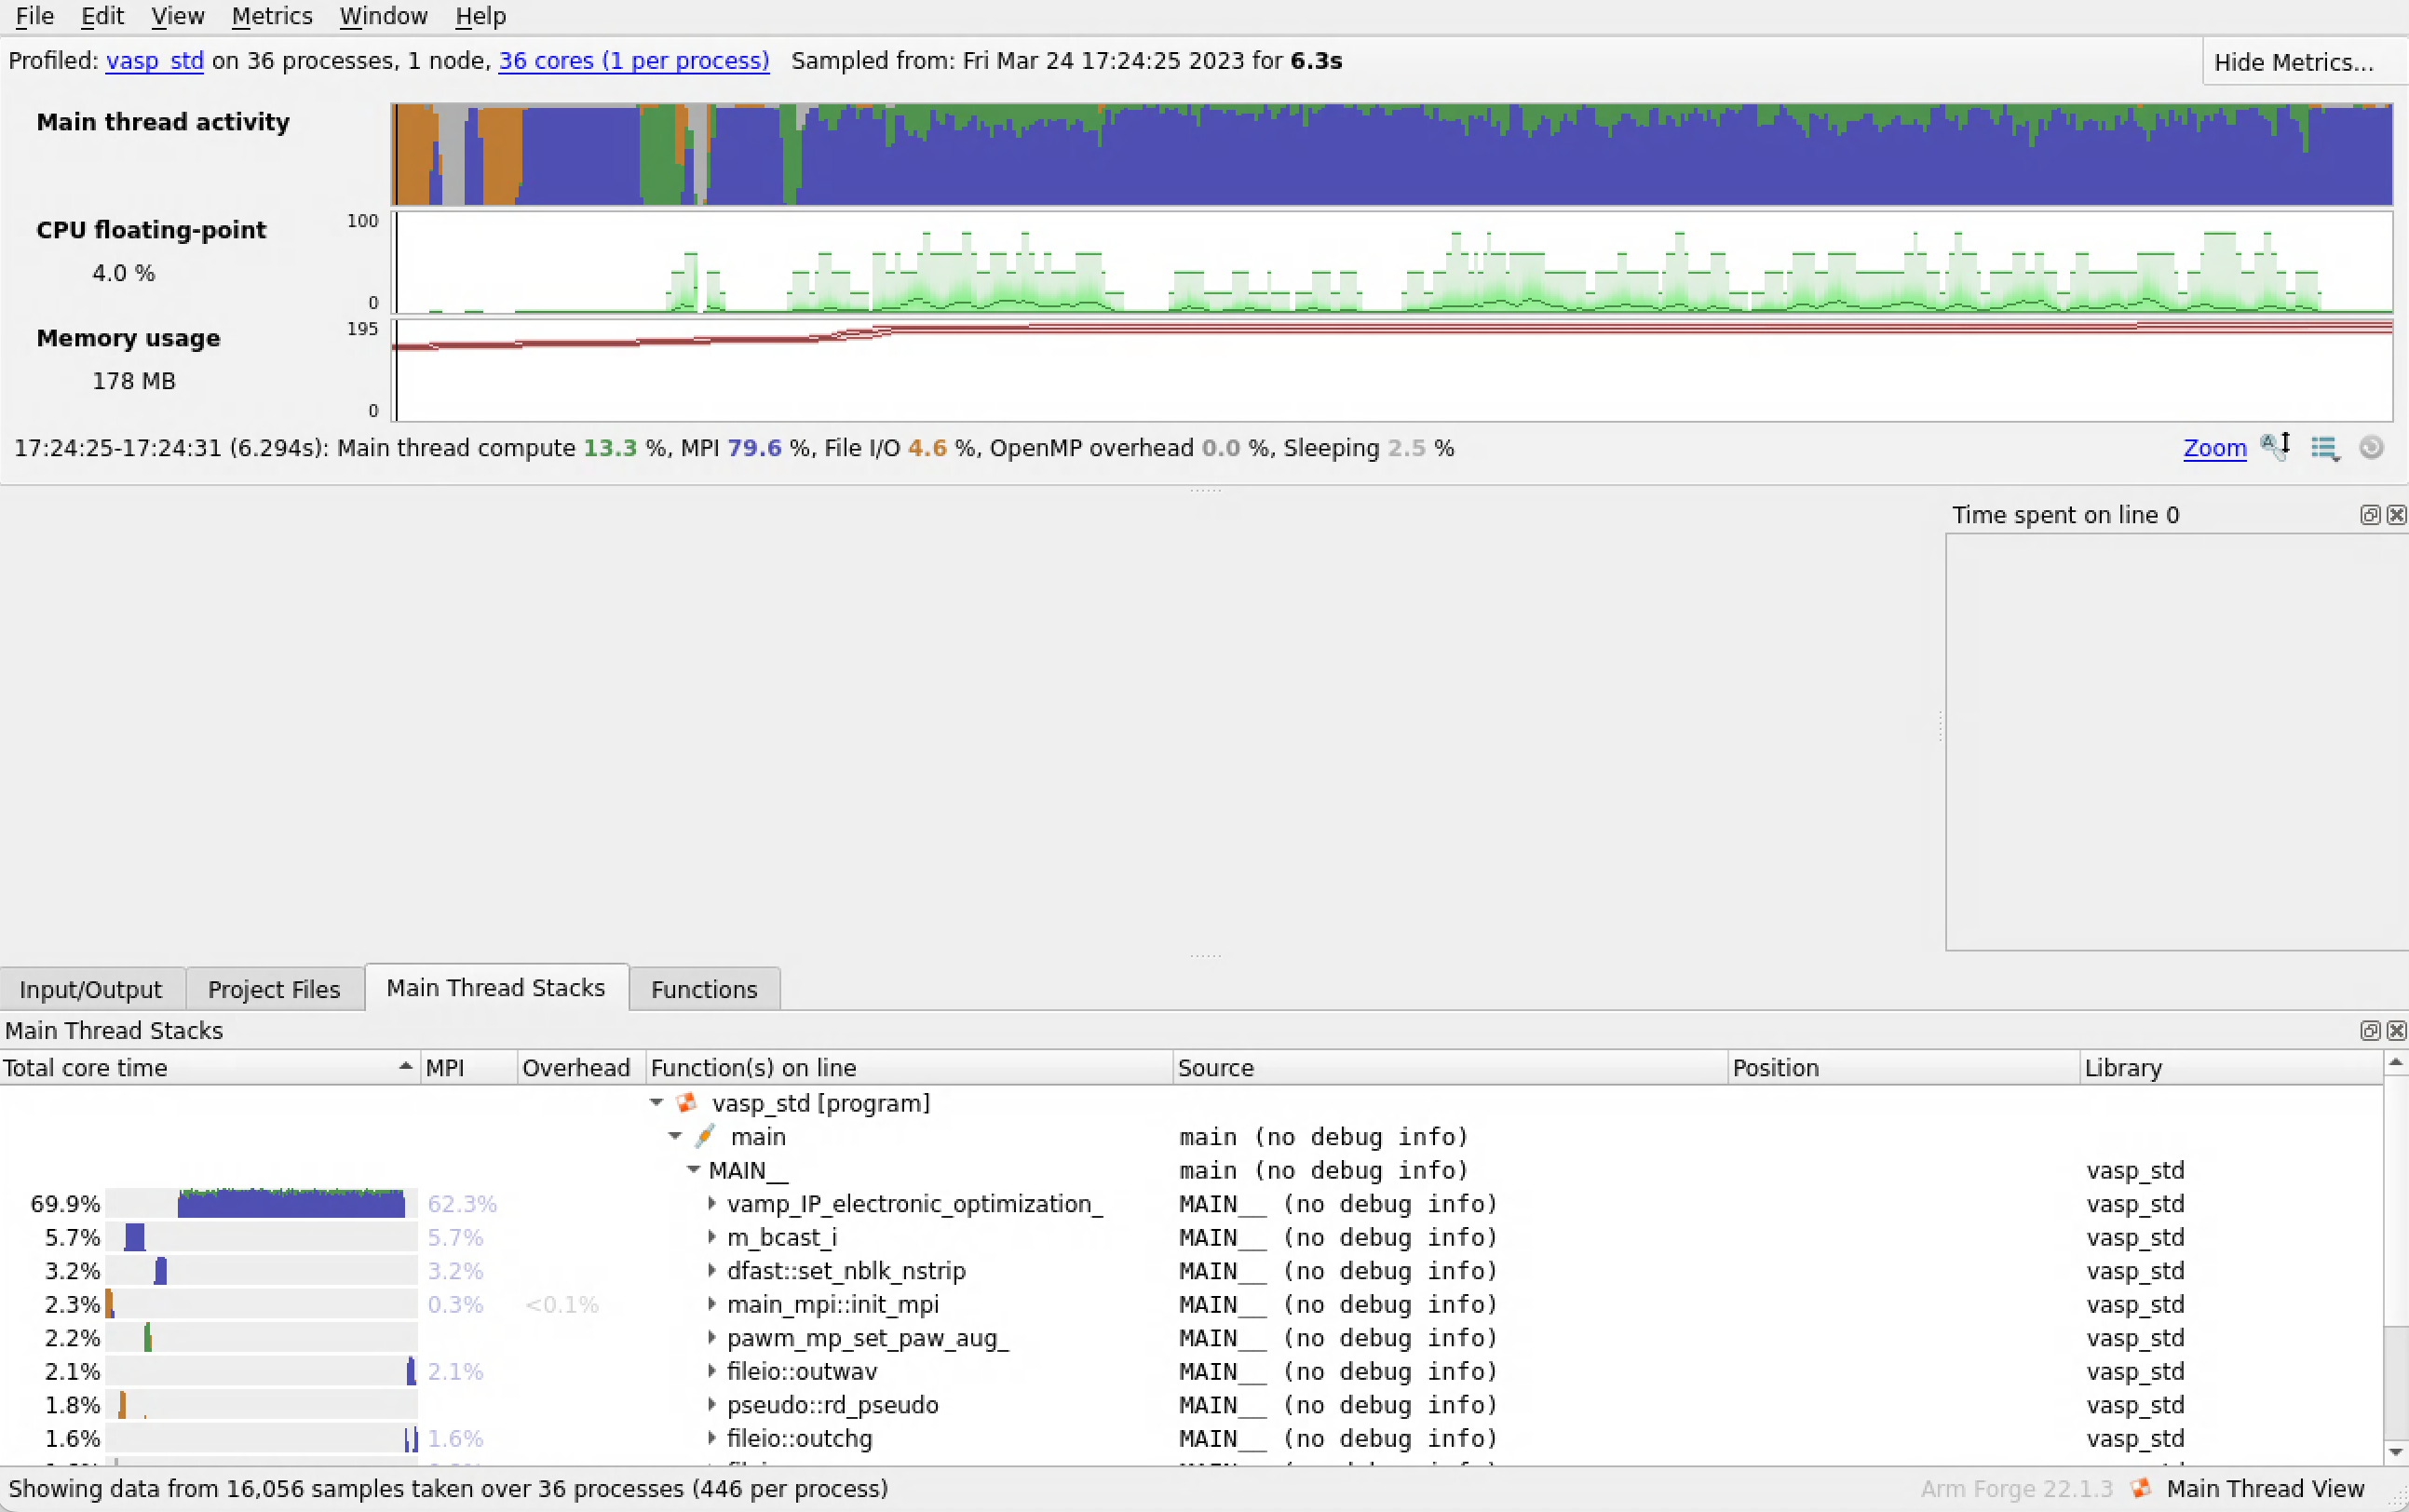
Across the bottom we have different view tabs. The I/O view displays your program I/O. The Project Files view allows you to navigate through your code base. The Functions view shows a flat profile of the functions in your program. The Stacks view allows you to follow down from the main function to see which code paths took the most time. Each line of the Stacks view shows the performance of one line of your source code, including all the functions called by that line.
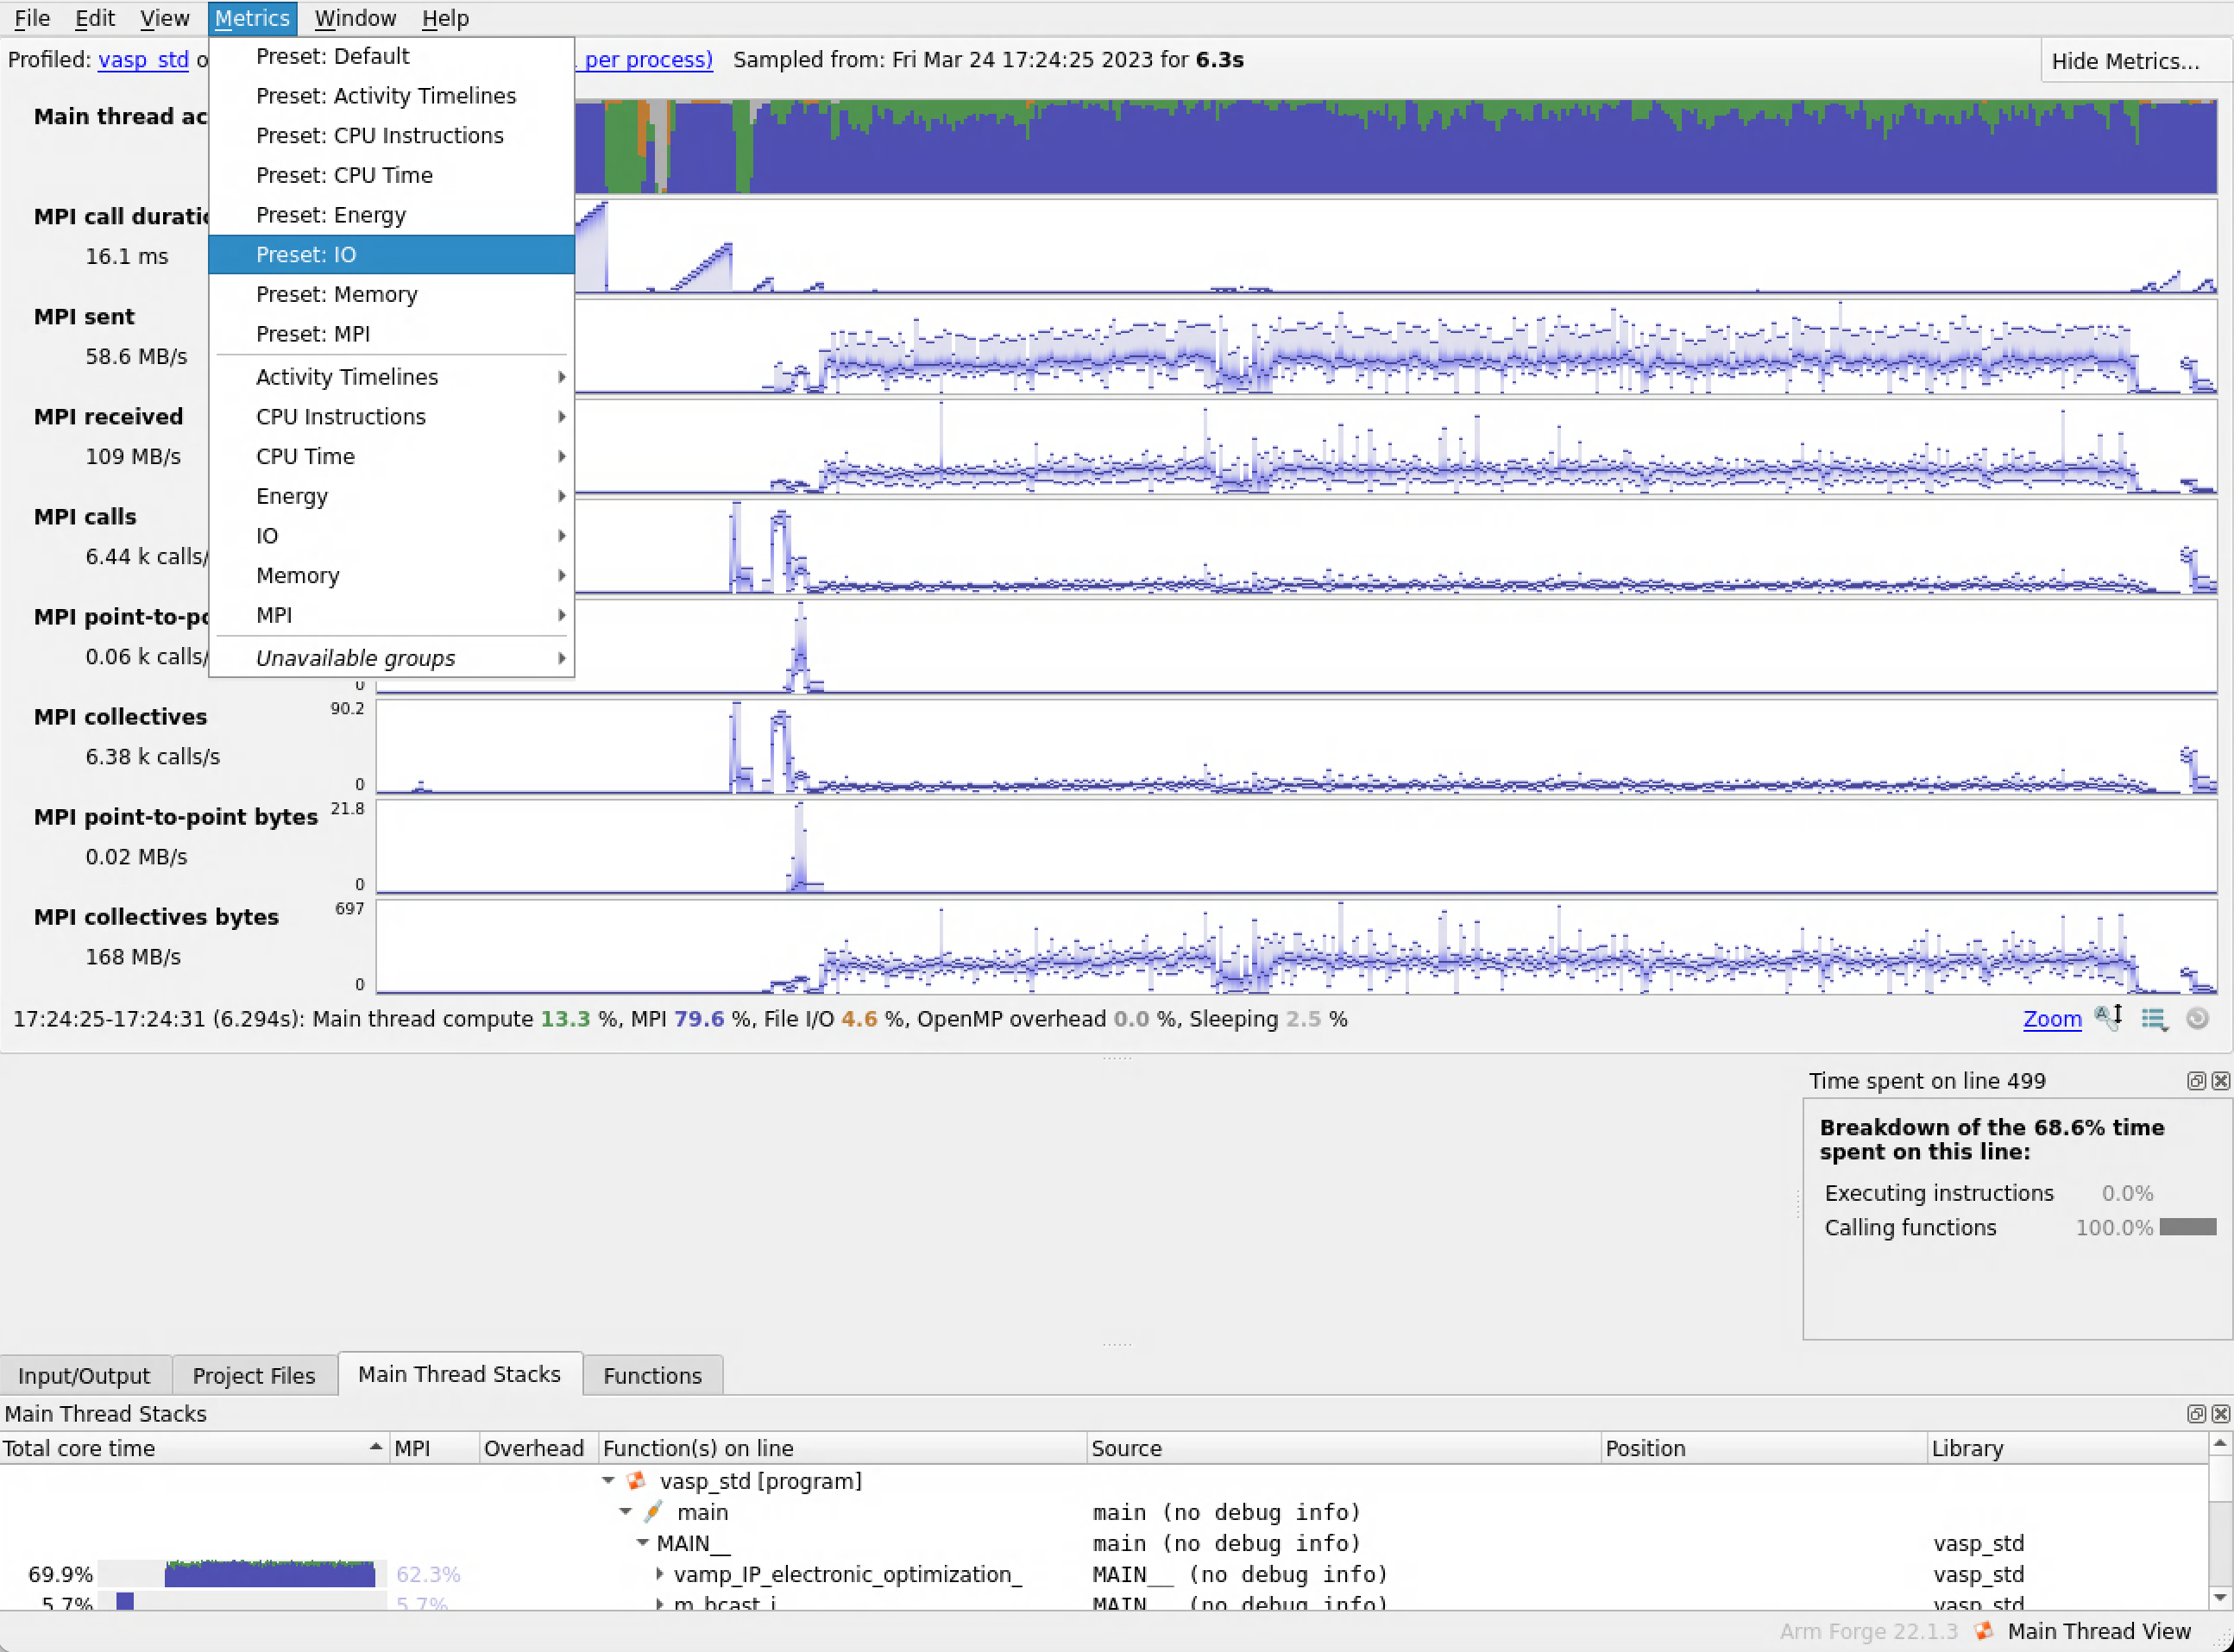
You can select different metrics to view from the metrics menu:
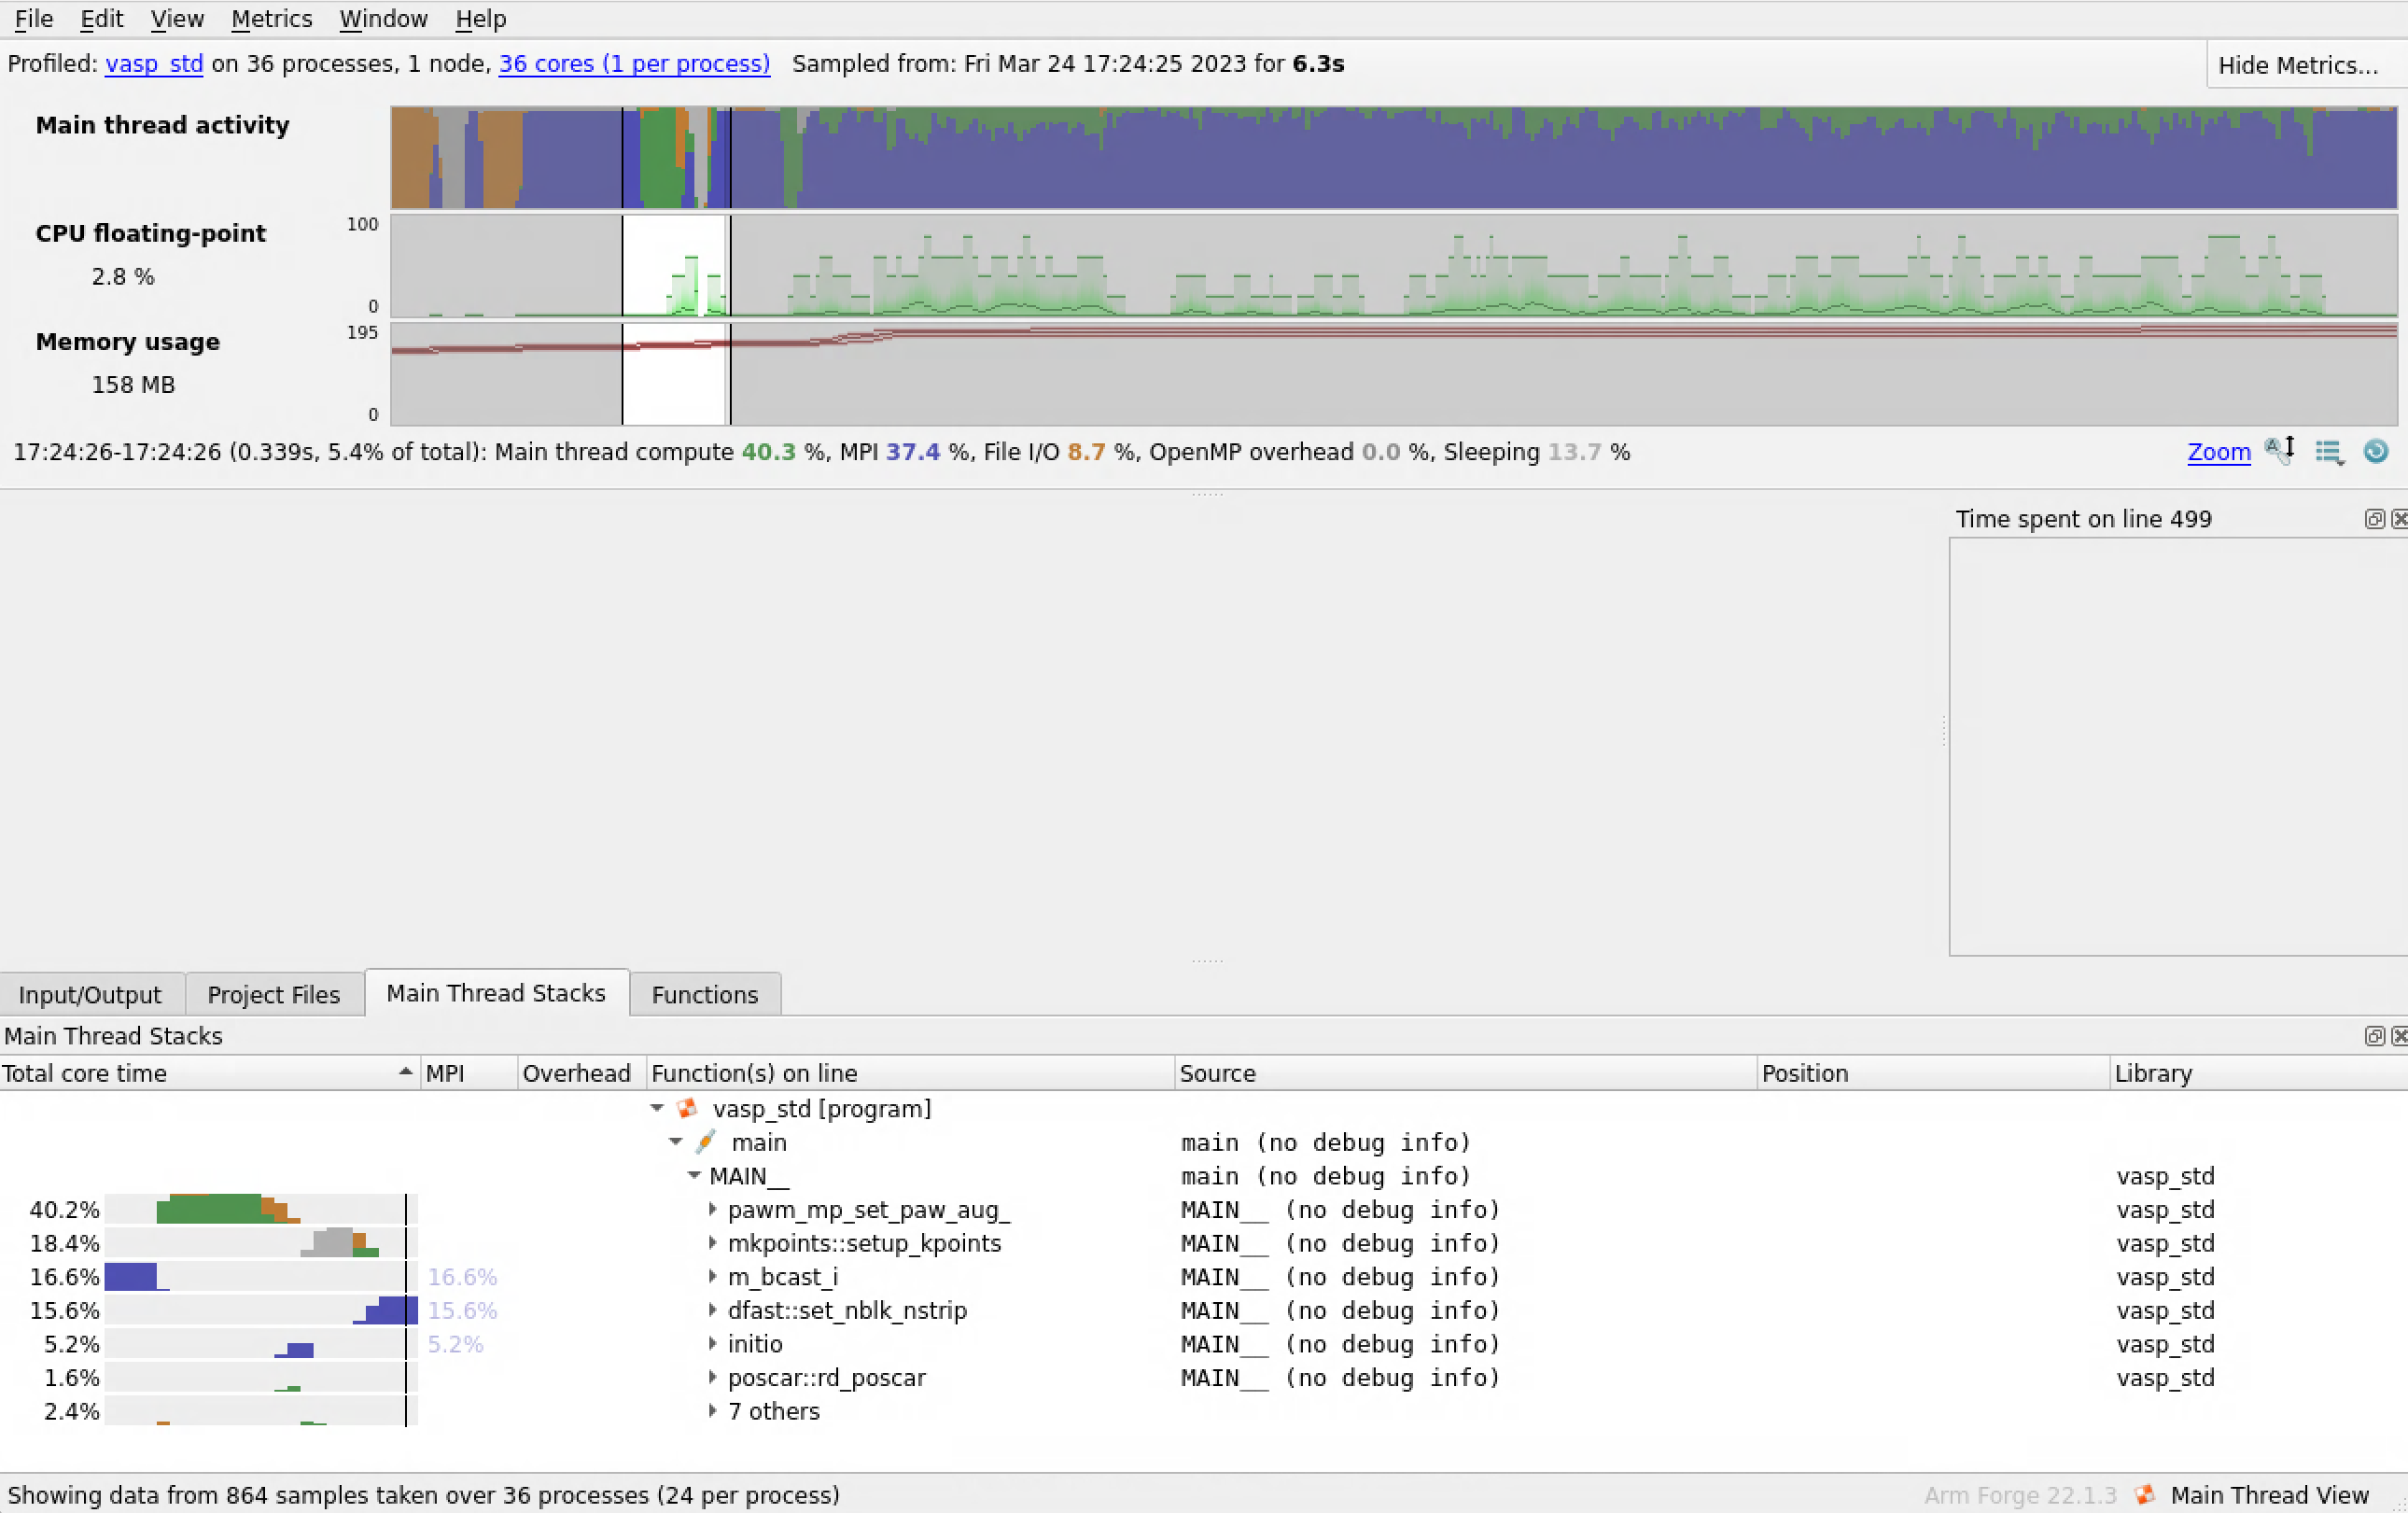
As well as zoom in on specific times in your program run.
By clicking on the functions in the “Main Thread Stacks,” the profiler will take you to those calls in your code. Here we see that the call to the Davidson algorithm takes 68.6% of the program time.
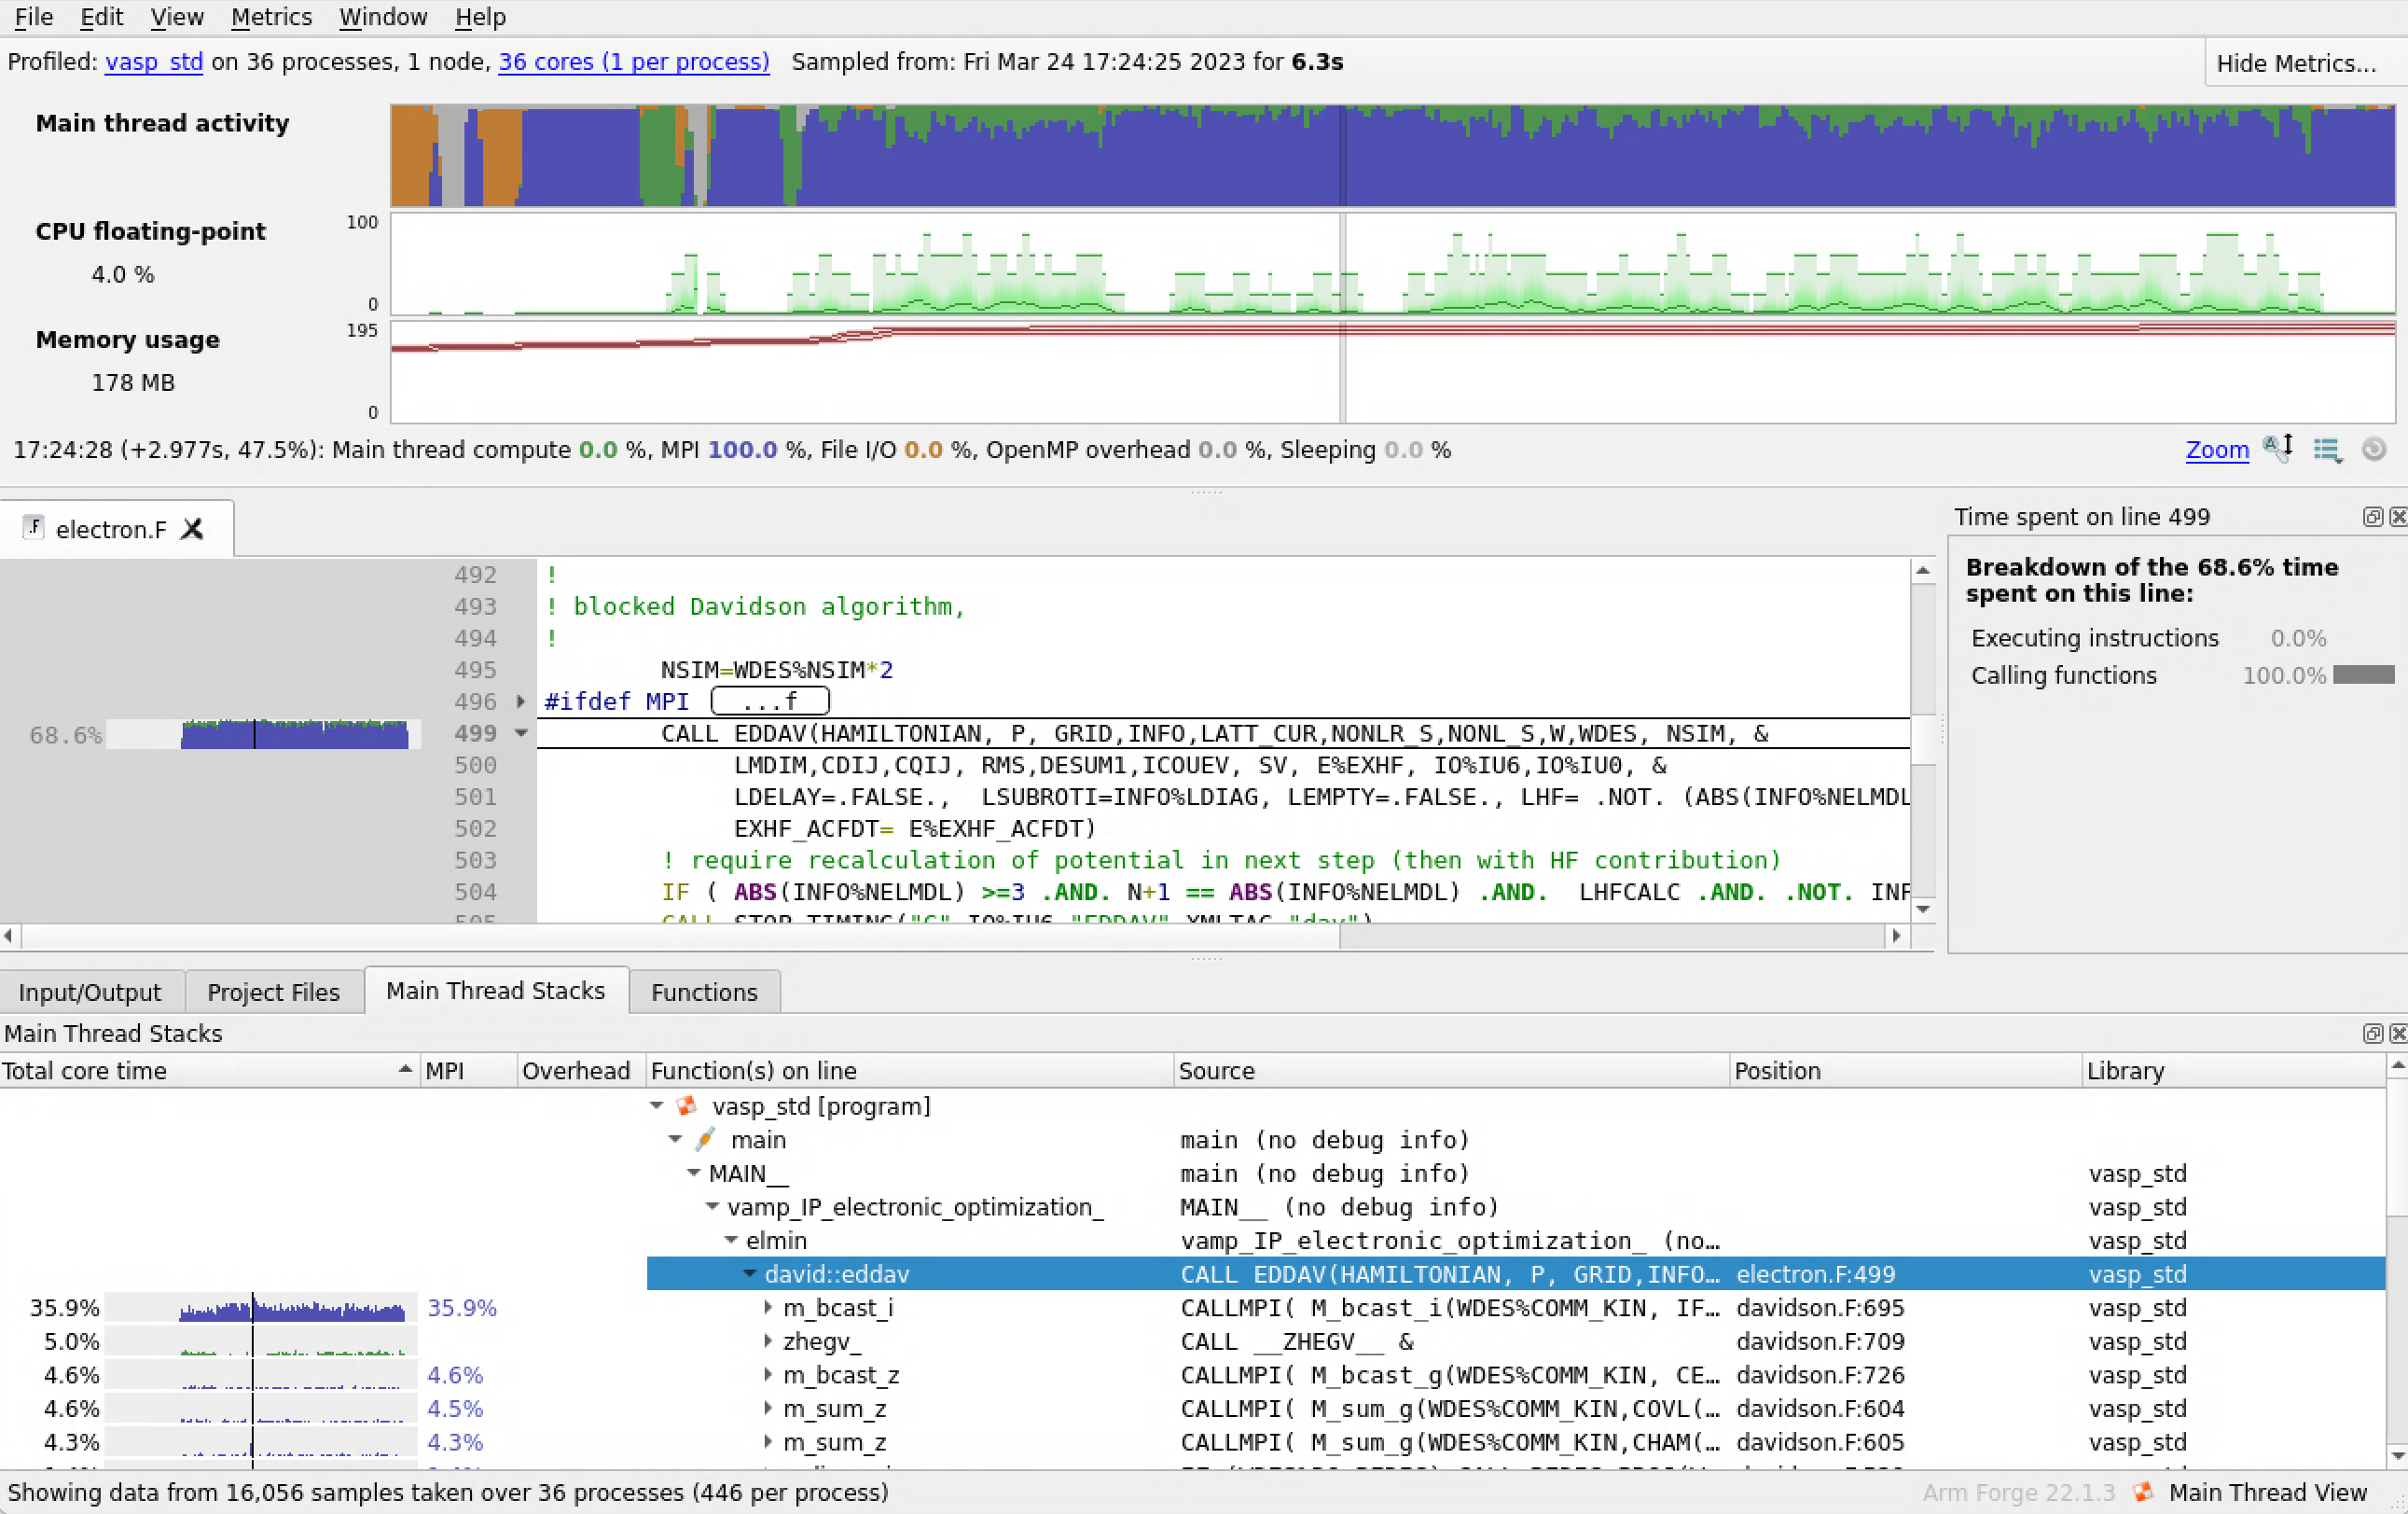
Digging in further, we can find that most of the time is spent in the CALLMPI function, and the activity shows as blue indicating this MPI communication and wait time.
See the next section MAP for how to obtain these.