flasc.analysis.energy_ratio_heterogeneity_mapper.heterogeneity_mapper#
- class flasc.analysis.energy_ratio_heterogeneity_mapper.heterogeneity_mapper(df_raw, fm)[source]#
Bases:
objectClass for calculating and visualizing the heterogeneity in the inflow wind speed.
This class is useful to calculate the energy ratios of a set of upstream turbines to then derive the heterogeneity in the inflow wind speed. This can be helpful in characterizing the ambient wind speed distribution for operational assets where we do not have such information. Note that heterogeneity may come from multiple sources, not only neighboring farms but also blockage effects of the farm itself.
Methods
Estimate the heterogeneity in the inflow wind speed.
Generate a dataframe for a FLORIS heterogeneous map.
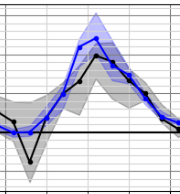
Plot the energy ratios for all upstream turbines for each wind direction bin.
Plot the layout of the wind farm with the inflow wind speed heterogeneity.
- estimate_heterogeneity(df_upstream, wd_array=array([0., 3., 6., 9., 12., 15., 18., 21., 24., 27., 30., 33., 36., 39., 42., 45., 48., 51., 54., 57., 60., 63., 66., 69., 72., 75., 78., 81., 84., 87., 90., 93., 96., 99., 102., 105., 108., 111., 114., 117., 120., 123., 126., 129., 132., 135., 138., 141., 144., 147., 150., 153., 156., 159., 162., 165., 168., 171., 174., 177., 180., 183., 186., 189., 192., 195., 198., 201., 204., 207., 210., 213., 216., 219., 222., 225., 228., 231., 234., 237., 240., 243., 246., 249., 252., 255., 258., 261., 264., 267., 270., 273., 276., 279., 282., 285., 288., 291., 294., 297., 300., 303., 306., 309., 312., 315., 318., 321., 324., 327., 330., 333., 336., 339., 342., 345., 348., 351., 354., 357.]), wd_bin_width=6.0, ws_range=[6.0, 11.0])[source]#
Estimate the heterogeneity in the inflow wind speed.
- Parameters:
df_upstream (_type_) -- _description_
wd_array (_type_, optional) -- _description_. Defaults to np.arange(0.0, 360.0, 3.0).
wd_bin_width (float, optional) -- _description_. Defaults to 6.0.
ws_range (list, optional) -- _description_. Defaults to [6.0, 11.0].
- Returns:
- A dataframe containing the energy ratios for all upstream turbines
for each wind direction bin.
- Return type:
pd.DataFrame
- plot_graphs(ylim=[0.8, 1.2], pdf_save_path=None)[source]#
Plot the energy ratios for all upstream turbines for each wind direction bin.
- Parameters:
ylim (list, optional) -- The y-axis limits for the plots. Defaults to [0.8, 1.2].
pdf_save_path (str, optional) -- The path to save the plots as a PDF. Defaults to None.
- generate_floris_hetmap()[source]#
Generate a dataframe for a FLORIS heterogeneous map.
- Returns:
A dataframe containing the FLORIS heterogeneous map values.
- Return type:
pd.DataFrame
- plot_layout(ylim=[0.8, 1.2], plot_background_flow=False, pdf_save_path=None)[source]#
Plot the layout of the wind farm with the inflow wind speed heterogeneity.
- Parameters:
ylim (list, optional) -- The y-axis limits for the plots. Defaults to [0.8, 1.2].
plot_background_flow (bool, optional) -- Whether to plot the background flow. Defaults to False.
pdf_save_path (str, optional) -- The path to save the plots as a PDF. Defaults to None.
- Returns:
The figure and axis objects.
- Return type:
tuple