DuraMAT Live Demo (HPC)#
![]()
Steps:
Initialize weather data into xarray
Calculate installation standoff for New Mexico
Plot results
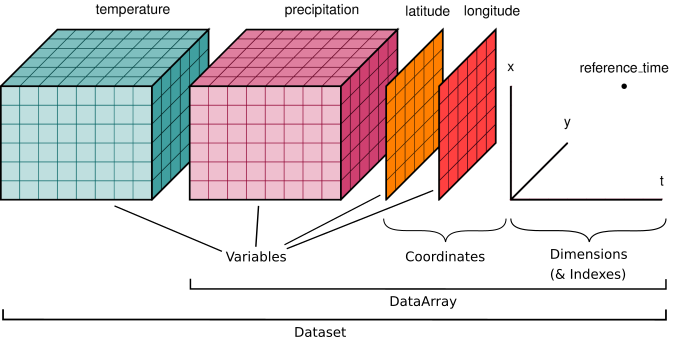
Xarray: multi-dimensional data frame
import pandas as pd
import pvdeg
# This information helps with debugging and getting support :)
import sys
import platform

print("Working on a ", platform.system(), platform.release())
print("Python version ", sys.version)
print("Pandas version ", pd.__version__)
print("pvdeg version ", pvdeg.__version__)
Working on a  Windows 11
Python version  3.12.9 | packaged by Anaconda, Inc. | (main, Feb  6 2025, 18:49:16) [MSC v.1929 64 bit (AMD64)]
Pandas version  2.2.3
pvdeg version  0.5.1.dev623+g51cc68b8e.d20250905
1 Start distributed compute cluster - DASK#
pvdeg.geospatial.start_dask()
Dashboard: http://127.0.0.1:8787/status
# Get weather data
weather_db = "NSRDB"

weather_arg = {
    "satellite": "Americas",
    "names": 2022,
    "NREL_HPC": True,
    "attributes": [
        "air_temperature",
        "wind_speed",
        "dhi",
        "ghi",
        "dni",
        "relative_humidity",
    ],
}

weather_ds, meta_df = pvdeg.weather.get(weather_db, geospatial=True, **weather_arg)
---------------------------------------------------------------------------
ConnectionError                           Traceback (most recent call last)
Cell In[4], line 18
      2 weather_db = "NSRDB"
      4 weather_arg = {
      5     "satellite": "Americas",
      6     "names": 2022,
   (...)
     15     ],
     16 }
---> 18 weather_ds, meta_df = pvdeg.weather.get(weather_db, geospatial=True, **weather_arg)

File ~\Documents\GitHub\PVDegradationTools_NREL\pvdeg\weather.py:255, in get(database, id, geospatial, find_meta, **kwargs)
    253 elif geospatial:
    254     if database == "NSRDB":
--> 255         nrel_kestrel_check()
    257         weather_ds, meta_df = get_NSRDB(geospatial=geospatial, **kwargs)
    258         meta_df["wind_height"] = 2

File ~\Documents\GitHub\PVDegradationTools_NREL\pvdeg\utilities.py:1227, in nrel_kestrel_check()
   1224 device_domain = ".".join(host.stdout.split(".")[-4:])[:-1]
   1226 if kestrel_hostname != device_domain:
-> 1227     raise ConnectionError(
   1228         f"""
   1229         connected to {device_domain} not a node of {kestrel_hostname}")
   1230         """
   1231     )

ConnectionError:
            connected to  not a node of kestrel.hpc.nrel.gov")
weather_ds
meta_NM = meta_df[meta_df["state"] == "New Mexico"]
meta_NM_sub, gids_NM_sub = pvdeg.utilities.gid_downsampling(meta_NM, 4)
weather_NM_sub = weather_ds.sel(gid=meta_NM_sub.index)
geo = {
    "func": pvdeg.standards.standoff,
    "weather_ds": weather_NM_sub,
    "meta_df": meta_NM_sub,
}

standoff_res = pvdeg.geospatial.analysis(**geo)
standoff_res
fig, ax = pvdeg.geospatial.plot_USA(
    standoff_res["x"],
    cmap="viridis",
    vmin=0,
    vmax=None,
    title="Minimum estimated air standoff to qualify as level 1 system",
    cb_title="Standoff (cm)",
)
Relative Humidity Example - Time dimension#
# State bar of new mexico: (35.16482, -106.58979)

weather_db = "NSRDB"
weather_id = (35.16482, -106.58979)  # NREL (39.741931, -105.169891)
weather_arg = {
    "satellite": "Americas",
    "names": 2022,
    "NREL_HPC": True,
    "attributes": [
        "air_temperature",
        "wind_speed",
        "dhi",
        "ghi",
        "dni",
        "relative_humidity",
    ],
}

weather_df, meta = pvdeg.weather.get(
    weather_db, weather_id, geospatial=False, **weather_arg
)
RH_module = pvdeg.humidity.module(weather_df=weather_df, meta=meta)
RH_module
RH_module.plot(ls="--")
geo = {
    "func": pvdeg.humidity.module,
    "weather_ds": weather_NM_sub,
    "meta_df": meta_NM_sub,
}

RH_module = pvdeg.geospatial.analysis(**geo)
RH_module
# from matplotlib.animation import FuncAnimation
# from matplotlib.animation import PillowWriter
# import matplotlib.animation as animation
# import datetime
# ims = []
# for n in range(1, 13):
#     for i, np_t in enumerate(RH_module.time):
#         t = pd.Timestamp(np_t.values).time()
#         d = pd.Timestamp(np_t.values).day
#         m = pd.Timestamp(np_t.values).month
#         if m == n:
#             if d == 15:
#                 if t == datetime.time(12):
#                     fig, ax = pvdeg.geospatial.plot_USA(RH_module['RH_surface_outside'].sel(time=np_t),
#                             cmap='viridis', vmin=0, vmax=100,
#                             title=f'RH_surface_outside  - 2022-{m}-{d} 12:00',
#                             cb_title='Relative humidity (%)')
#                     plt.savefig(f'./images/RH_animation_{n}.png', dpi=600)

# import imageio
# ims = [imageio.imread(f'./images/RH_animation_{n}.png') for n in range(1, 13)]
# imageio.mimwrite(f'../images/RH_animation.gif', ims, format='GIF', duration=1000, loop=10)