HP-RTU + ASHP Boiler + Demand Control Ventilation + Heat/Energy Recovery + Economizers
Author: Marlena Praprost
Executive Summary
Building on the successfully completed effort to calibrate and validate the U.S. Department of Energy’s ResStock™ and ComStock™ models over the past several years, the objective of this work is to produce national data sets that empower analysts working for federal, state, utility, city, and manufacturer stakeholders to answer a broad range of analysis questions.
The goal of this work is to develop energy efficiency, electrification, and demand flexibility end-use load shapes (electricity, gas, propane, or fuel oil) that cover a majority of the high-impact, market-ready (or nearly market-ready) upgrade measures, or upgrades. “Measures” refers to energy efficiency variables that can be applied to buildings during modeling.
An end-use savings shape is the difference in energy consumption between a baseline building and a building with an energy efficiency, electrification, or demand flexibility upgrade applied. It results in a time-series profile that is broken down by end use and fuel (electricity or on-site gas, propane, or fuel oil use) at each time step.
ComStock is a highly granular, bottom-up model that uses multiple data sources, statistical sampling methods, and advanced building energy simulations to estimate the annual sub-hourly energy consumption of the commercial building stock across the United States. The baseline model intends to represent the U.S. commercial building stock as it existed in 2018. The methodology and results of the baseline model are discussed in the final technical report of the End-Use Load Profiles project.
An upgrade package applies one or more End-Use Savings Shapes upgrades to a single building model simulation. Since ComStock is a bottom-up physics-based model, an upgrade package will go beyond aggregating or summing the individual upgrade results and produce novel results by simulating interactions between the upgrades. For example, pairing an envelope upgrade with an electrification upgrade would likely result in higher savings results than the sum of these upgrades individually, and the size of the heating, ventilating, and air conditioning (HVAC) equipment may be reduced if the envelope upgrade reduces the loads significantly.
This documentation focuses on an upgrade package of five End-Use Savings Shapes upgrades— Heat Pump Rooftop Unit (HP-RTU), Air-Source Heat Pump (ASHP)-Boiler, Economizers, Exhaust Air Heat Recovery (HR)/Energy Recovery, and Demand Control Ventilation (DCV). This combination of upgrades will collectively be referred to as the “HP-RTU + ASHP Boiler + DCV + HR + Economizers” package. HP-RTUs are applied to buildings with gas or electric RTUs, while the ASHP-Boiler measure is applied to buildings with existing boilers systems. Energy Recovery, Economizers, and DCV each have their own applicability criteria, which will be discussed in subsequent sections. The intent of this HP-RTU + ASHP Boiler + DCV + HR + Economizers package is to upgrade the existing building stock with top-of-the-line HVAC equipment and energy savings features wherever possible. This includes replacing two of the most common types of HVAC systems (RTUs and boilers) with heat pumps, and retrofitting HVAC systems with energy savings features like Energy Recovery, DCV, and Economizers. More details on the individual upgrades can be found on the ComStock Measures Documentation page.
The HP-RTU and ASHP-Boiler measures were applicable to 33%, and 29% of the stock floor area, respectively. It is important to note that the HVAC systems that receive the HP-RTU or ASHP-Boiler upgrade make up 62% of the ComStock floor area, but 91% of the stock natural gas heating. The Economizer, DCV, and Exhaust Air Heat/Energy Recovery measures were applicable to 57%, 71%, and 78% of the stock floor area, respectively. There will be significant overlap in the applicability when the individual measures are combined into a package. For example, for a building with an RTU, the HP-RTU measure will be applied first, replacing the existing RTU with a HP-RTU. Then, the DCV, Economizer, and Heat Recovery measures will be applied after if the new HP-RTU does not already have each of these features.
The HP-RTU + ASHP Boiler + DCV + HR + Economizers package demonstrates 19.8% total site energy savings (857 trillion British thermal units [TBtu]) for the U.S. commercial building stock modeled in ComStock (Figure 9). The savings are a result of electrification of gas-furnace and boiler systems, which are then combined with efficiency upgrades like DCV, Heat/Energy Recovery, and Economizers:
-
86.7% stock heating gas savings (740.8 TBtu)
-
-84.9% stock heating electricity savings (-148.7 TBtu)
-
21.8% stock cooling electricity savings (145.5 TBtu)
-
18.6% stock fan electricity savings (96.5 TBtu).
The HP-RTU + ASHP Boiler + DCV + HR + Economizers package demonstrates between 49 and 56 million metric tons (MMT CO2e) of greenhouse gas emissions avoided for the three grid electricity scenarios presented, as well as 50 MMT CO2e of greenhouse gas emissions avoided for on-site natural gas consumption.
Acknowledgements
The authors would like to acknowledge the authors of the original measures in the HP-RTU + ASHP Boiler + DCV + HR + Economizers package: Chris CaraDonna, Janghyun Kim, Korbaga Woldekidan, Andrew Parker, Ryan Meyer, and Amy LeBar. Thank you to the reviewers of this package, Matthew Dahlhausen and Shanti Pless.
1. Introduction
This documentation covers the “HP-RTU + ASHP Boiler + DCV + HR + Economizers” upgrade methodology and briefly discusses key results. Results can be accessed via the ComStock™ Published Datasets page.
| Package Title | HP-RTU + ASHP Boiler + DCV + HR + Economizers |
| Package Definition | This package upgrades or replaces a wide variety of HVAC systems. It is a combination of five upgrades released in 2023 Releases 1 and 2 and 2024 Release 1: Heat Pump Rooftop Unit (HP-RTU), Air-Source Heat Pump (ASHP)-Boiler, Demand Control Ventilation (DCV), Economizers, and Exhaust Air Heat/Energy Recovery. |
| Applicability | This package is applicable to 85% of the stock floor area. For a package to be applicable, the model must meet the applicability criteria of one or more of the measures. HP-RTU: Models that contain gas-fired or electric resistance RTUs. This measure is applicable to 33% of the stock floor area. ASHP-Boiler: Models with a natural gas boiler for space heating. This measure is applicable to 29% of the stock floor area. DCV: All air loops, except those that serve the space types and use HVAC system types listed in the “Not Applicable” section below. Approximately 71% of the stock floor area has one or more air loops eligible for this upgrade. Exhaust Air Heat/Energy Recovery: Air handling units (AHU) with outdoor air that do not already have an energy/heat recovery system, including single-zone packaged rooftop units, dedicated outdoor air systems, and multi-zone variable air volume systems. Approximately 78% of the stock floor area has one or more AHUs eligible for this upgrade. Economizers: Air systems with ventilation that do not already have economizers. Approximately 57% of the stock floor area has one or more air loops eligible for this upgrade. |
| Not Applicable | The package was not applicable to 15% of the stock. This means none of the five measures in the package were applied to the model. HP-RTU: Models that do not contain gas-fired or electric resistance RTUs. Not applicable to kitchen spaces. ASHP-Boiler: Models not using a natural gas boiler for space heating such as those with a furnace or district heat source. DCV: This measure is not applicable to the following building types: Hotels, Restaurants. This measure is not applicable to the following space types: Kitchen, Dining, Healthcare Patient Room, Laboratory. This measure is also not applicable to models with the following HVAC system types: Dedicated outdoor air system (DOAS), Packaged terminal air-conditioner (PTAC), Packaged terminal heat pump (PTHP). Exhaust Air Heat/Energy Recovery: Systems that are not air loops with outdoor air, or systems that already have energy/heat recovery. Additionally, this measure is not applicable to Restaurant building types. Economizers: Buildings that already have economizers or do not have ventilation systems. |
| Release | 2024 Release 1: 2024/comstock_amy2018_release_1/ |
2. Technology Summary
Many technologies are used to provide space heating in commercial building HVAC systems. Packaged rooftop units (RTUs) are currently used to heat 37% of commercial buildings in the United States (representing 50% of the total commercial floor space) [1]. The HP-RTU measure replaces packaged rooftop unit systems with high-efficiency heat pump RTUs. Natural gas used by boilers and furnaces accounts for 73% of space heating end-use energy consumption in the United States [1]. Retrofitting natural gas boilers with air-source heat pump (ASHP) boilers offers a decarbonization solution for this equipment. Heat pumps offer a high-performance electric option for commercial building space heating. Their use of electricity for heating enables pathways toward decarbonization, as they deliver space heating 2–4 times more efficiently than electric resistance options. Heat pumps currently provide space heating for only approximately 11% of commercial buildings (representing 15% of the total floor area) [1].
This upgrade package leverages either a high-performance HP-RTU or ASHP-Boiler retrofit along with other HVAC options that can be applied to a variety of systems: Economizers, Demand Control Ventilation (DCV), and Energy/Heat Recovery. Economizers increase outdoor ventilation air during periods when the system requests cooling and the controls determine the outdoor air is cold enough to be beneficial. The measure adds economizer controls to air handling units (AHUs) that do not already have this functionality. DCV saves energy by reducing the rate at which outdoor air is delivered during periods of less-than-design occupancy. This measure will enable DCV for applicable air loops and use model occupancy schedules to control the DCV. Air-to-air energy/heat recovery systems exchange heat and/or moisture between conditioned exhaust air and incoming outdoor ventilation air for AHUs with outdoor air. They are intended to precondition outdoor ventilation air using exhaust air before heating/cooling coils are used, which can reduce ventilation loads. In this measure, energy recovery with sensible and latent exchange gets added in humid climate zones, whereas heat recovery with sensible-only exchange gets added in drier climate zones.
The upgrade package applies the five upgrade scenarios based on the applicability criteria of each individual upgrade. A model will have all, some, or none of the upgrades applied depending on how the model’s characteristics align with each upgrade’s applicability criteria, which is detailed in Section 3. Note that the HP-RTU and the ASHP-Boiler retrofit scenarios are mutually exclusive, so no building will have both applied. Further, the economizer, DCV, and Energy/Heat Recovery measures can be applied to buildings that received a heat pump retrofit or existing HVAC systems that are not applicable to the heat pump retrofits.
For details about each of the five technologies, reference their individual upgrade documentation: HP-RTU, ASHP-Boiler, Economizers, Exhaust Air Heat/Energy Recovery, and DCV.
3. ComStock Baseline Approach
The following sections provide high-level summaries of the ComStock baseline approach for RTUs, Boilers, Economizers, DCV, and Heat/Energy Recovery. For more detail about how these systems are modeled in the ComStock baseline, including data sources, reference the National Renewable Energy Laboratory’s ComStock Reference Documentation report [2].
3.1. Rooftop Units
The state of the existing RTUs in ComStock is based on a combination of when the buildings were built and how the equipment has been updated over time, described in detail in the ComStock Reference Documentation report [2]. Equipment performance is assumed to meet the energy code requirements in force at the time and place of installation. For this reason, most of the existing RTUs are modeled as constant air volume with single-speed compressors. This is influential to the results in this analysis because energy savings will be calculated by comparing the energy performance of the ComStock baseline models to an updated version of the ComStock models that use the proposed HP-RTUs.
The energy codes in place for the ComStock baseline is shown as a percentage of applicable floor area in Figure 1. Applicable floor area for this analysis includes ComStock buildings with “PSZ-AC with gas coil” and “PSZ-AC with electric coil” HVAC system types (where PSZ-AC stands for packaged single-zone air conditioner). Most ComStock baseline RTUs follow energy code requirements from the early 2000s. Other energy efficiency features such as DCV, energy recovery, and economizer control are only applied to baseline ComStock RTUs if required by the in-force energy code for the particular model. The ComStock workflow checks the necessary characteristics of each RTU to determine if the feature is required. Similarly, heating, cooling, and fan efficiencies are set based on the in-force code year. For models with the “PSZ-AC with electric coil” HVAC system type, the ComStock baseline will use electric resistance coils with a coefficient of performance (COP) of 1. For models with the “PSZ-AC with gas coil” HVAC system type, the ComStock baseline will use a gas furnace efficiency of generally around 80%.
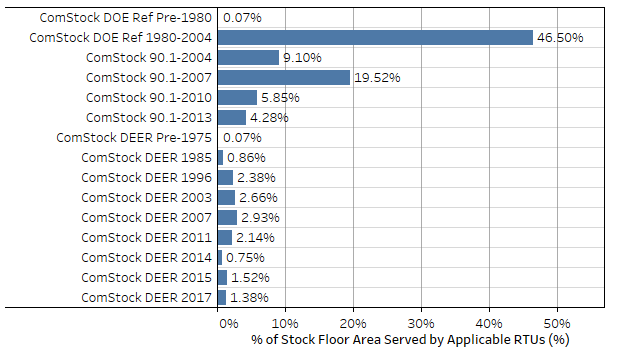
Figure 1. ComStock baseline in-force energy code followed as a percentage of applicable floor area. Applicable floor area includes ComStock buildings with “PSZ-AC with gas coil” and “PSZ-AC with electric coil” HVAC system types.
3.2. Boilers
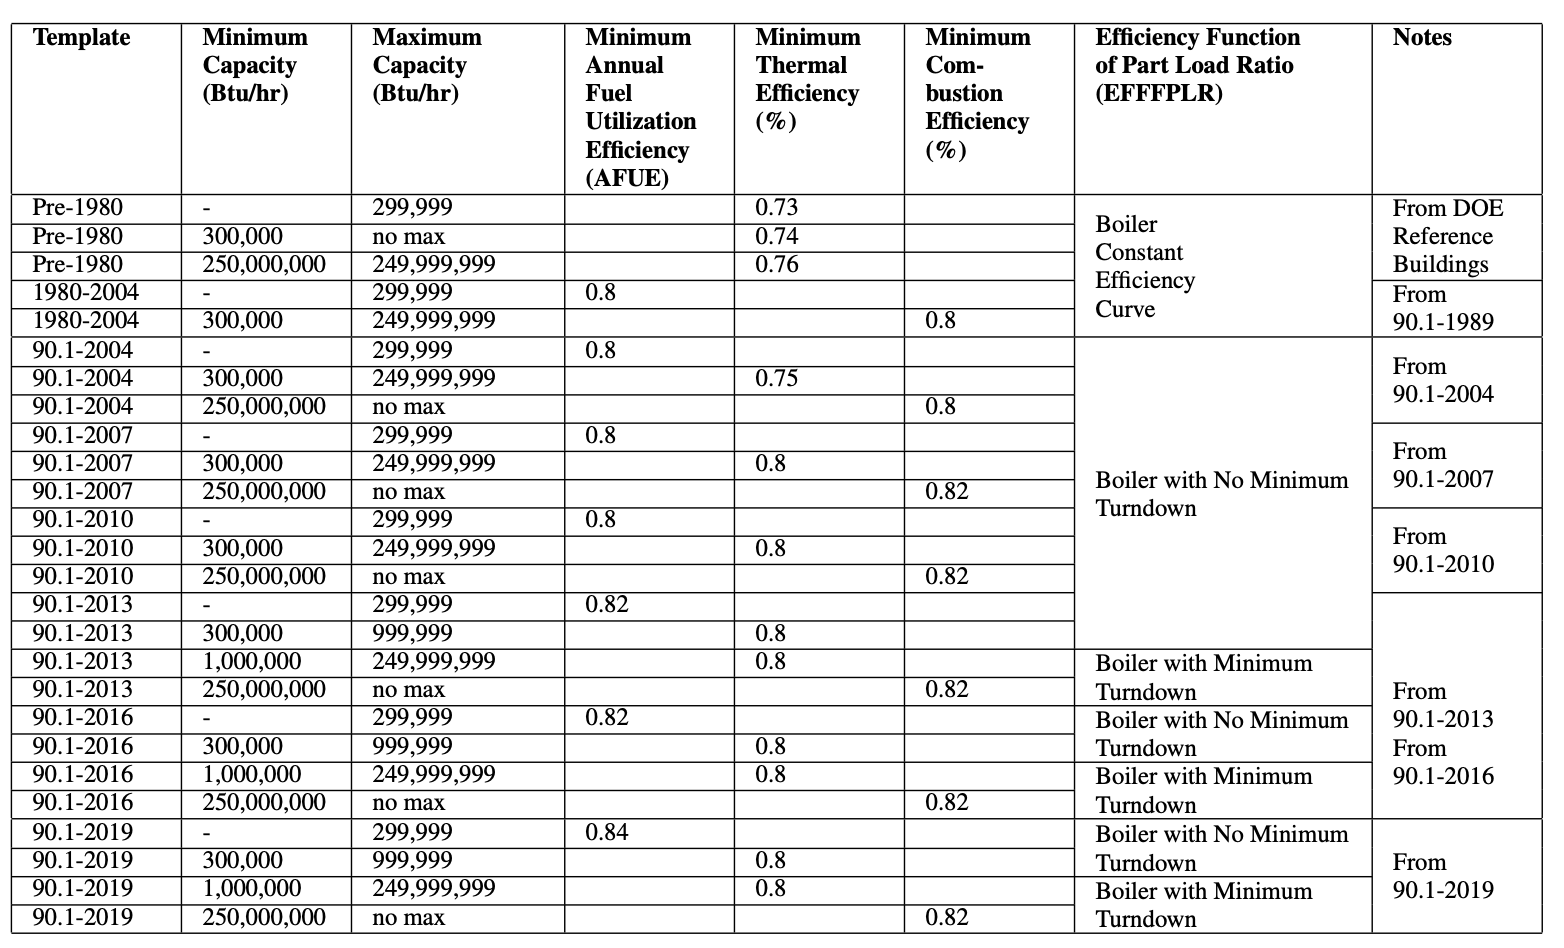
The current version of boilers in ComStock are gas-fired, noncondensing boilers. The efficiencies of the boilers are assigned based on the U.S. Department of Energy’s reference buildings templates and capacities; Table 1 summarizes the values [2]. As indicated in Table 1, three different performance curves were used to adjust the efficiency of the boiler based on part-load ratio. All ComStock boilers have a heating set point of 180°F with a capacity to modulate flow.
Table 1. Boiler Efficiency and Performance Curve Assignment
3.3. Economizers
ComStock baseline building models include HVAC systems with or without economizers, and configurations (e.g., control type and high limit) of economizers vary depending on different building parameters (e.g., climate zone). These decisions related to economizer configurations are determined by the requirements of the energy code that was in force when the HVAC system was last updated.
Figure 2 shows the prevalence of economizers (in terms of floor area coverage and contribution to cooling energy) for different subcategories (building type and ventilation system type) of the existing building stock. To note, the percentage of floor area shown as true for the “economizer availability” represents the total building area if there is at least one economizer available in the building; thus, it does not mean the actual floor area coverage by the economizers. While there are buildings that already include economizers in variable air volume (VAV) systems and roof top units (RTU) covering 40% of the total floor area and 28% of total electricity used for cooling, the remaining portion of buildings for those system types does not leverage economizers in the baseline. HVAC system types such as packaged terminal units, dedicated outdoor air systems (DOAS), or residential systems without ventilation are not the target of this upgrade. More detailed information of the upgrade applicability is described in Section 3.3.2.
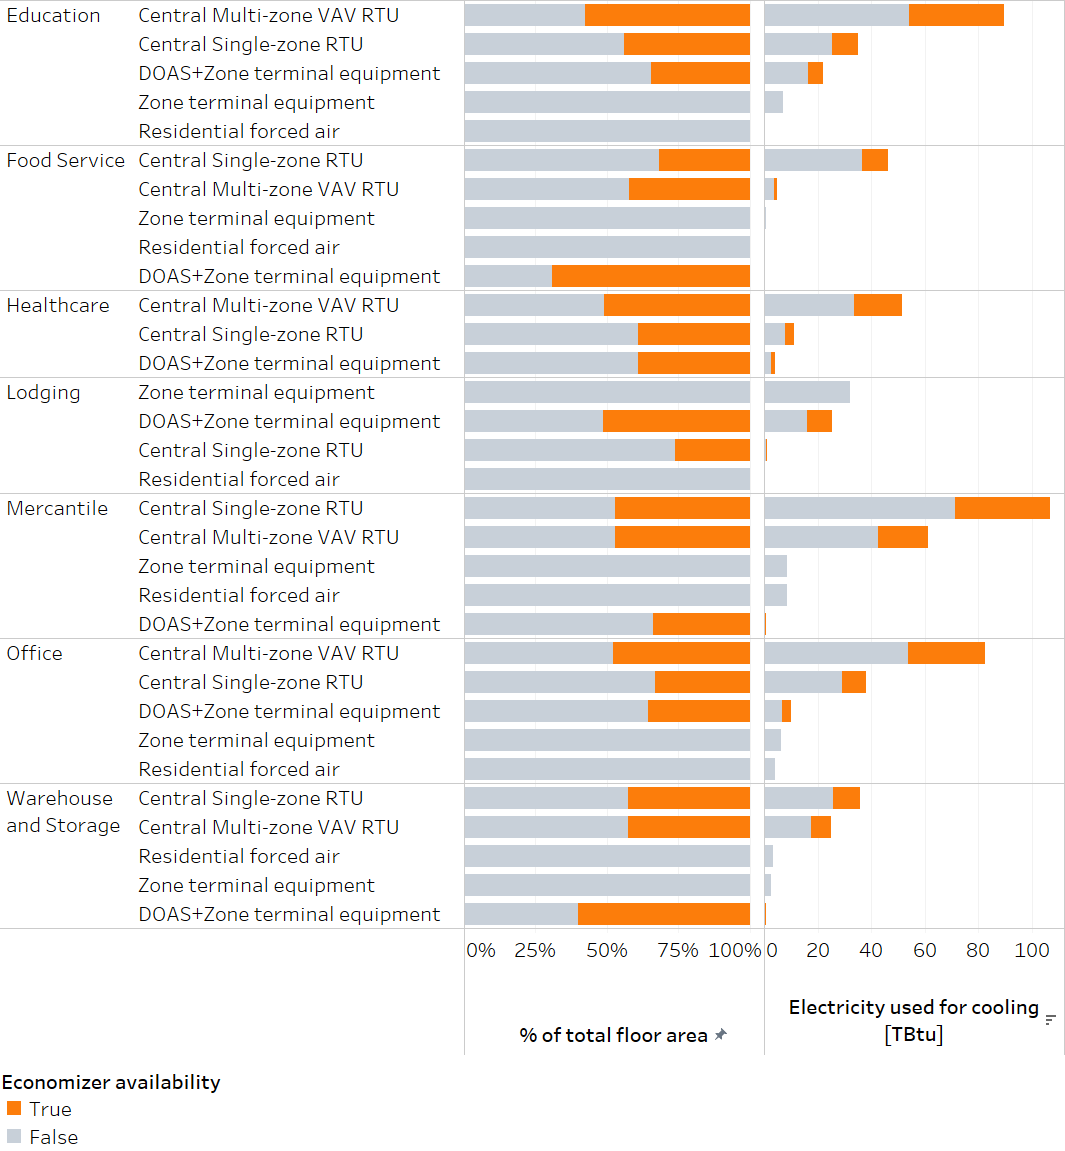
Figure 2. Contribution of ventilation system types on energy
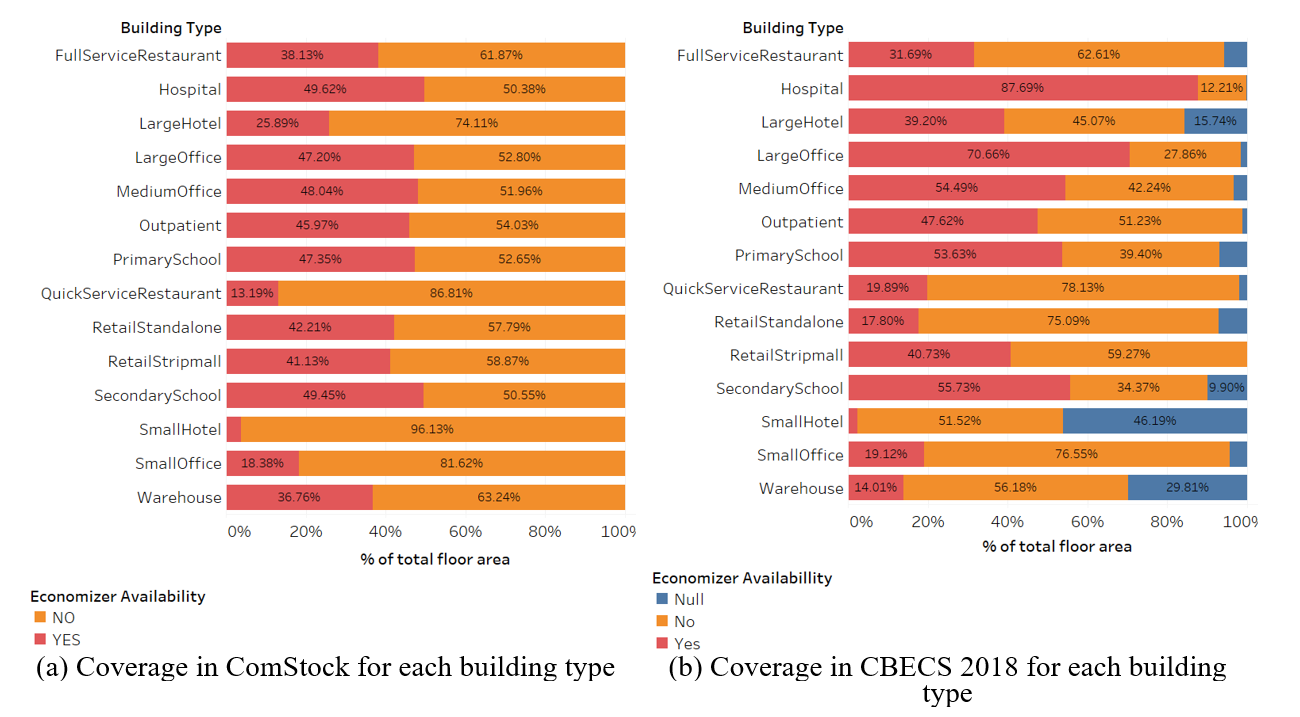
Figure 3 shows the comparison of economizer coverage with respect to building floor area between ComStock and estimation from Commercial Buildings Energy Consumption Survey [1]. Again, because of how data are structured in CBECS, the floor area coverage shown in these figures is representing the entire floor area of the building if any economizer is present in any of the HVAC systems in the building, rather than actual floor area coverage by HVAC systems with economizers. Because CBECS data only shows total building area instead of total area covered by the economizers, this comparison is mostly to understand the ballpark estimation of economizers.
 l
l
Figure 3. Economizer floor area coverage between ComStock and CBECS 2018
3.4. Demand Control Ventilation
DCV is required in ASHRAE 90.1 (2007–present), IECC (2009–present), and California Title 24 (1996–present) energy codes. DCV is included in ComStock models when required by the governing ASHRAE 90.1 energy code for the specific spaces/systems in the model. ComStock gathers the necessary criteria for determining DCV requirements and includes DCV functionality only if the space/system requires. Requirement criteria for DCV includes space floor area, space design occupant density, system economizer prevalence, system design outdoor airflow rate, and system energy recovery prevalence. The 90.1 code year for a model is based on the year of the model’s last major HVAC replacement. A summary of the floor area served by a system with DCV is shown in Table 2. Note that DCV is not required by ASHRAE 90.1 when an HVAC system has an energy recovery ventilator (ERV).
Table 2. Fraction of Floor Area Controlled by HVAC System with DCV by Building Type and Code Year
| Building Type |
|
|
|
|
|
|
|
|
|
|
|
|
|
|
|
|---|---|---|---|---|---|---|---|---|---|---|---|---|---|---|---|
FullService Restaurant | 0 | 0 | 0 | 0.263 | 0.091 | 0.197 | 0 | 0 | 0 | 0.559 | 0.561 | 0.567 | 0.541 | 0.568 | 0.549 |
| Hospital | 0 | 0 | 0 | 0 | 0 | 0 | 0 | 0 | 0 | 0.387 | 0.423 | 0.376 | 0.154 | 0.226 | 0.389 |
| LargeHotel | 0 | 0 | 0 | 0.009 | 0.005 | 0.023 | 0 | 0 | 0 | 0.073 | 0.067 | 0.051 | 0.125 | 0.059 | 0.143 |
| LargeOffice | 0 | 0 | 0 | 0 | 0 | 0 | 0 | 0 | 0 | 0 | 0 | 0 | 0 | 0 | 0 |
| MediumOffice | 0 | 0 | 0 | 0 | 0 | 0 | 0 | 0 | 0 | 0 | 0 | 0 | 0 | 0 | 0 |
| Outpatient | 0 | 0 | 0 | 0.048 | 0.015 | 0.011 | 0 | 0 | 0 | 0 | 0 | 0 | 0 | 0 | 0 |
| PrimarySchool | 0 | 0 | 0 | 0.507 | 0.023 | 0.033 | 0 | 0 | 0 | 0.825 | 0.806 | 0.789 | 0.773 | 0.823 | 0.715 |
| QuickService Restaurant | 0 | 0 | 0 | 0.017 | 0.008 | 0.033 | 0 | 0 | 0 | 0.387 | 0.388 | 0.351 | 0.349 | 0.366 | 0.362 |
| RetailStandalone | 0 | 0 | 0 | 0 | 0 | 0 | 0 | 0 | 0 | 0 | 0 | 0 | 0 | 0 | 0 |
| RetailStripmall | 0 | 0 | 0 | 0.204 | 0.036 | 0.025 | 0 | 0 | 0 | 0.185 | 0.169 | 0.163 | 0.165 | 0.168 | 0.113 |
| SecondarySchool | 0 | 0 | 0.040 | 0.512 | 0.008 | 0.022 | 0 | 0 | 0 | 0.772 | 0.693 | 0.756 | 0.830 | 0.809 | 0.662 |
| SmallHotel | 0 | 0 | 0 | 0.002 | 0 | 0.000 | 0 | 0 | 0 | 0 | 0 | 0 | 0 | 0 | 0 |
| SmallOffice | 0 | 0 | 0 | 0 | 0 | 0 | 0 | 0 | 0 | 0 | 0 | 0 | 0 | 0 | 0 |
| Warehouse | 0 | 0 | 0 | 0 | 0 | 0 | 0 | 0 | 0 | 0 | 0 | 0 | 0 | 0 | 0 |
One important observation from these data is that no office buildings include DCV in the ComStock baseline. This is because office buildings are currently modeled using a single, blended space type that is a fractional mix of open offices, enclosed offices, conference rooms, etc., and the occupancy density of this blended space does not exceed the DCV thresholds in ASHARE 90.1. This leads to unrealistically low (0%) DCV in office buildings in the baseline building stock, which may overestimate the savings for stock-wide DCV implementation.
For more details about how DCV is modeled in the ComStock baseline, see the ComStock Reference Documentation [2].
3.5. Exhaust Air Heat/Energy Recovery
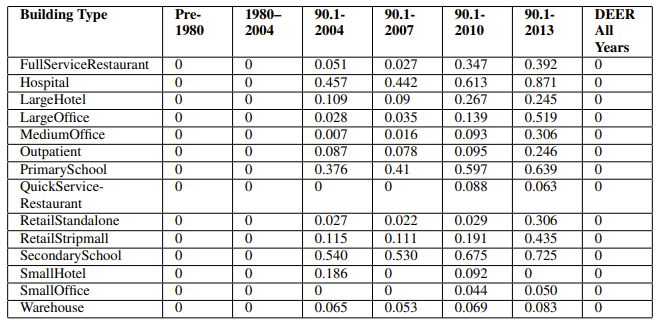
The ComStock baseline includes energy recovery in AHUs only when required by the governing energy code standard. The fraction of floor area conditioned by energy/heat recovery in ComStock is summarized in Table 4 by building type and energy code year. Note that older code years do not include heat/energy recovery, as they were not required by these energy codes. Also note that California models generally do not include heat/energy recovery because these models follow California Title 24 energy codes, which do not have heat/energy recovery requirements. The operation and performance of heat/energy recovery systems in the ComStock baseline are not discussed in this work because existing heat/energy recovery systems are not affected by this measure. More information about the ComStock baseline heat/energy recovery systems can be found in the ComStock Reference Documentation [2].
The prevalence of heat/energy recovery in the ComStock baseline directly impacts the results of this analysis, as the measure will only be applied to AHUs that do not already include heat/energy recovery. Note that ComStock adds heat/energy recovery to models on an AHU-by-AHU basis, meaning a ComStock baseline model may have some AHUs with heat/energy recovery and some without, based on the code requirements. This measure is also applied on an AHU basis, so it may be partially applicable to some ComStock models. The ComStock code-driven approach for applying heat/energy recovery is reasonable but difficult to validate. The most prominent commercial building stock assessment, CBECS, does not include prevalence of heat/energy recovery systems [1]. Because heat/energy recovery code requirements often depend on system size, ComStock’s estimates may either overstate or underestimate the prevalence of existing systems with heat/energy recovery due to zoning assumptions. This, in turn, affects the number of systems that this measure upgrades and subsequently impacts the overall energy-saving potential of the technology in the building stock.
The benefits of heat/energy recovery systems depend on routing exhaust air through the heat exchanger. As discussed, some portion of the exhaust air in buildings may not be routed back to the central exhaust or heat exchanger, either due to duct leakage or separate exhaust fans. ComStock includes exhaust fans in some space types, summarized in Table
- Note that some prominent building types, such as small/medium/large office, warehouse, and retail, do not currently include any zone exhaust, so all exhaust air is assumed to return to the AHUs and become available for heat/energy recovery benefits, when applicable. Furthermore, ComStock models do not currently include duct leakage. These factors may overestimate the amount of exhaust air available for heat/energy recovery in ComStock models.
Table 3. Building and Space Types in ComStock Modeled With Zone Exhaust Fans
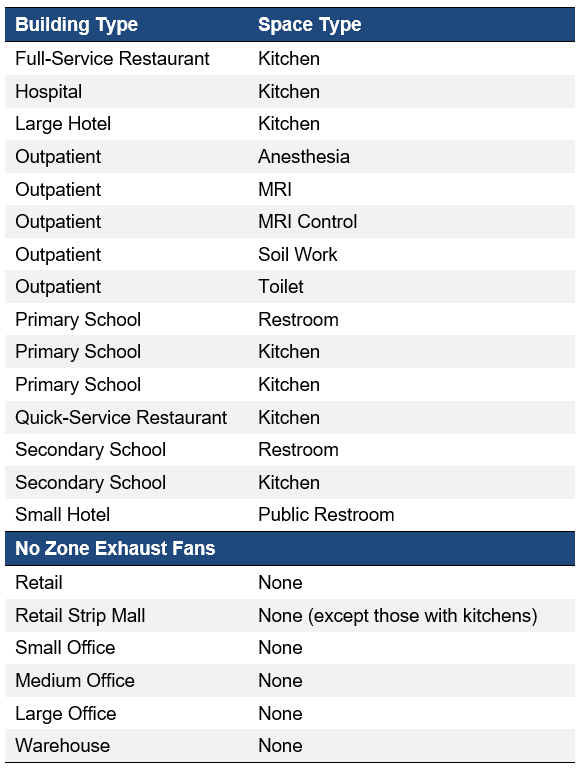
Table 4. Fraction of ComStock Floor Area Conditioned by Systems With Heat/Energy Recovery by Building Type and Code Year
DEER stands for the Database of Energy Efficiency Resources, which is used to implement Title 24 energy codes in ComStock California models.
4. Modeling Approach
The following sections summarize the modeling approach and applicability for each of the 5 individual measures included in the HP-RTU + ASHP Boiler + DCV + HR + Economizers upgrade package. For more detailed descriptions, reference the individual upgrade documents.
4.1. Heat Pump Rooftop Unit
The Heat Pump Rooftop Unit upgrade replaces RTUs with HP-RTUs where applicable. The HP-RTUs are modeled using the EnergyPlus® “AirloopHVAC:UnitarySystem” object [3]. An OpenStudio® upgrade is used in conjunction with the ComStock workflow to modify/remove any applicable RTUs in the ComStock baseline models (“PSZ-AC with gas coil” and “PSZ-AC with electric coil”) and articulate the appropriate HP-RTU objects and settings. Nonapplicable systems are not affected, nor are core operational parameters of systems such as schedules, thermostat set points, unoccupied operation behavior, and design outdoor airflow rates. Furthermore, energy-saving features found in applicable baseline RTUs such as air-side heat/energy recovery, economizers, or DCV are preserved as-is for the new HP-RTU systems. This enables comparability, noting that these features are feasible and available in HP-RTU systems. The modeling details of the HP-RTU system are described further in the individual upgrade documentation.
Heat pumps in colder climates usually require a source of supplemental heat, which today is often sized to meet the entirety of the heating load. This is because heat pump capacity is reduced as outdoor ambient temperatures decrease, which generally corresponds to the highest heating loads for the building. The supplemental heat source is often electric resistance, which has an effective site COP of 1, whereas the heat pump system will often demonstrate a site COP much higher than this even at temperatures down to −17.8°C. Sizing heat pump systems to address more of the heating load is sometimes suggested because the heat pump heating is more efficient than electric resistance, so long as the sizing of the heat pump system still enables effective operation for both heating and cooling [4], [5]. However, this analysis simply sizes the heat pumps based on cooling load, and reserves studying the impact of other sizing approaches for future analyses.
Key assumption include:
-
The new HP-RTUs are modeled with top-of-the-line variable-speed compressors and fans. Performance curves are used to determine how efficiency and capacity vary with indoor and outdoor temperature and part-load ratio, including cycling losses. At full compressor speed, the performance curves yield 56% and 46% COP and capacity retention at 0°F, respectively.
-
The heat pump system is sized to the design cooling load, with supplemental heating used to address any additional loads.
-
The supplemental heating coil matches the fuel type of the original heating system. If the original RTU used gas heating, a new gas supplemental heating coil with a COP of 0.8 is used in the new HP-RTU. If the original RTU used electric heating, an electric resistance supplemental heating coil with a COP of 1 is used.
-
The minimum operating temperature for the heat pumps is modeled at 0°F, which is the default setting for some manufacturers. The compressor will lock out below this temperature, and only supplemental heat will be available.
4.1.1. Applicability
The HP-RTU upgrade is applicable to ComStock models with either gas furnace RTUs (“PSZ-AC with gas coil”) or electric resistance RTUs (“PSZ-AC with electric coil”). ComStock HVAC distributions are informed by the 2018 CBECS [1]. The methodology for interpreting CBECS data to create HVAC probability distributions for ComStock is discussed in the ComStock documentation [2]. The upgrade is also not applicable to space types that directly serve kitchens, spaces that are unconditioned, or RTUs with outdoor air ratios above 65% (due to an EnergyPlus® bug with cycling operation).
4.2. Air-Source Heat Pump Boiler
The Air-Source Heat Pump Boiler upgrade replaces natural gas boilers for space heating with ASHP boilers. Outputs from the simulation runs could be used to quantify the carbon reduction and energy impact of the electrification.
The upgrade provides multiple options for the natural gas boiler replacement. The following list summarizes the upgrade inputs and their default values used in the simulation run.
-
The hot water setpoint is set to 140°F and the heating coils are auto-sized using this new setpoint.
-
The heat pump is sized using an outdoor air temperature of 17°F. A maximum design capacity of 40 kW is used; if the model requires a higher capacity, multiple units will be added in the loop. A COP of 2.85 is assumed for the design outdoor air temperature.
-
Electric resistance heating is assumed to be the backup heat source, as opposed to keeping the existing boiler.
4.2.1. Applicability
This upgrade is applicable to the ComStock OpenStudio models with the following HVAC system types: DOAS with fan coil air-cooled chiller with boiler, DOAS with fan coil chiller with boiler, DOAS with fan coil district chilled water with boiler, DOAS with water-source heat pump cooling tower with boiler, packaged single zone air conditioner (PSZ-AC) with gas boiler, packaged variable air volume (PVAV) with gas boiler, PVAV with gas heat with electric reheat, variable air volume (VAV) air-cooled chiller with gas boiler reheat, VAV chiller with gas boiler reheat, and VAV district chilled water with gas boiler reheat.
4.3. Economizers
This measure enables dry-bulb or enthalpy-based air-side economizing in air systems depending on climate zone if not already present. The measure cycles through air loops checking for eligibility for the upgrade. If an air loop does not have outdoor air or already has a DOAS system or existing economizer, it is not eligible for the upgrade. For air loops that are eligible for the upgrade, the model gets the climate zone and sets the economizer type (FixedDryBulb, FixedEnthalpy, or FixedDewPointAndDryBulb) based on ASHRAE 90.1 requirements by climate zone. The measure then adds economizers to eligible air loops. More details are described in subsequent sections.
4.3.1. Configuration of Economizers
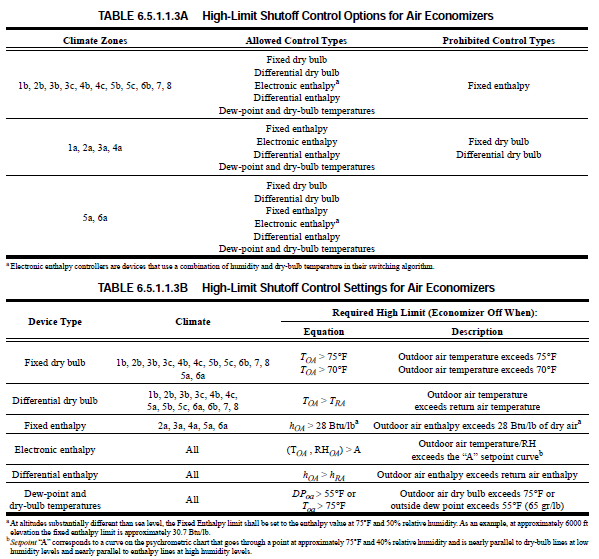
Specifics of a newly added economizer through an upgrade are applied in the same way as in models that already have economizers. In other words, configurations (e.g., control type and limit setting) are guided by the requirements of the energy code that was in force when the HVAC system was last updated. Each version of energy code (i.e., ASHRAE 90.1 or Title 24) includes best practices for leveraging economizers (depending on HVAC system size) as well as configuring economizers (depending on the climate zone). For example, ASHRAE 90.1-2010 includes information on preferable control types, prohibited control types, and high limits for fixed control types as shown in Table 5. While some details vary between versions, these suggestions largely reflect physical reasonings such as considering temperature as well as humidity (i.e., prohibiting dry-bulb controls) measurements when the building is in humid regions (e.g., 1a, 2a, 3a, or 4a). More details on ComStock’s economizer implementations are described in the ComStock Reference Documentation [2].
Table 5. Economizer Configuration Suggestions in ASHRAE 90.1-2010
4.3.2. Applicability
The applicability criterion of the economizer upgrade is simple: Economizers will be installed in buildings including air system with ventilation (i.e., AHUs and RTUs) that do not have economizers. Figure 4 shows the coverage of baseline buildings on floor area and highlights the economizer control types including floor area without economizers. The economizer upgrade will target the floor area without economizers shown in the figure for corresponding HVAC systems; however, the amount of savings will be determined by the weather, building’s outdoor air requirement, heat gain level in the return air stream, and configuration of the economizer.
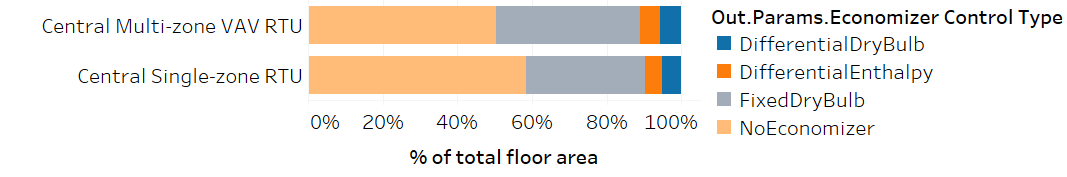
Figure 4. Upgrade applicability on building stock cooling energy
4.4. Demand Control Ventilation
This measure will cycle through the outdoor air loops in a model and enable DCV for air loops serving applicable space types. This will set the DCV field in the mechanical ventilation controller to “Yes” from “No.” As ComStock building models do not track CO2 levels, the models’ occupancy schedules will be used to control the DCV.
For the EnergyPlus DCV function to work properly, a space needs both a per-person and per-area outdoor air rate specified. In OpenStudio Standards, some space types have either 100% per-person or 100% per-area outdoor air rates specified. For these spaces on applicable air loops, outdoor air rates are converted to a per-person rate of 10 CFM/person, and the remainder of the outdoor air requirement is assigned as per-area.
4.4.1. Applicability
Hotels and restaurants will not be modified by the measure. Hotels typically have either single zone unitary systems (e.g., PTAC, PTHP) or DOAS meeting HVAC needs, neither of which are suitable for DCV. Air loops that serve a space type without a code-defined per-person ventilation rate will not have this measure applied. Due to high concentration of heat and effluents, kitchens and restaurants often require the design outdoor airflow rate all day to maintain indoor air quality and should not have the outdoor airflow reduced at periods of lower occupancy.
There are also certain space types for which DCV is not appropriate and will be skipped in this measure. The following space types will not be modified:
-
Kitchens
-
Dining
-
Laboratories
-
Healthcare patient spaces
-
Corridors and stairwells
-
Mechanical rooms
-
Data centers
-
High exhaust spaces, such as restrooms and locker rooms.
For the reasons listed above, kitchens in non-restaurant buildings will not have DCV applied. Dining areas in these buildings will also not have DCV applied because these areas frequently use transfer air from kitchens.
In hospitals, proper ventilation and indoor air quality must be maintained to ensure infection control and patient safety. For this reason, hospital space types dealing with patient care will not have DCV applied (e.g., patient, radiology, exam, and surgical rooms). Non-patient space types such as offices will have DCV applied. Additionally, laboratory space types found in hospitals will not have DCV applied per energy code guidance.
Air loops that serve both applicable and inapplicable space types will have DCV applied but will only function in spaces that are applicable. To do this, inapplicable space types will have their outdoor air rates converted to 100% per-area to avoid triggering the EnergyPlus function.
In addition to the space type and building type applicability constraints above, any model with a DOAS will not have DCV applied at this time. In addition, models with single-zone unitary systems (e.g., PTAC, PTHP) will not have DCV applied because they are entirely reliant on occupants to manually control the ventilation air and are unable to be controlled using occupancy or CO2 sensors. Models with ERVs are not required by ASHRAE 90.1 to have DCV, but it will be added to models with ERV in this measure to represent optimal operating conditions.
4.5. Exhaust Air Heat/Energy Recovery
The measure applies heat recovery to applicable AHUs in drier climate zones (ASHRAE climate zones 3B, 3C, 4B, 4C, 5B, 5C, and 6B) where addressing latent energy loads is of lesser concern. The heat recovery is modeled as aluminum counterflow plate heat exchangers and includes a bypass for temperature control and economizer lockout where applicable. Note that this measure does not modify the prevalence or operation of economizers in the existing AHUs; these properties are retained from the baseline ComStock model.
The measure applies energy recovery to applicable AHUs in humid climate zones where addressing latent loads with energy recovery would be beneficial. The energy recovery systems are modeled as membrane counterflow heat exchangers and include a bypass for temperature control and economizer lockout where applicable.
4.5.1. Applicability
The measure is applicable to all AHUs in the ComStock baseline that do not already include heat/energy recovery, excluding food service applications. Although there is evidence to suggest that exhaust air recovery can be applied to kitchen exhaust hoods, there are additional considerations that need to be factored in to meaningfully model the application, and these are beyond the scope of this study. As discussed, heat/energy recovery in the ComStock baseline are added if required by the governing energy code (Table 4). Note that some models may include a mix of applicable and nonapplicable AHUs. The measure is applied on a per-AHU basis, and therefore may be partially applicable to some ComStock models based on the prevalence of heat/energy recovery in the existing AHUs. AHUs for this study include VAV systems, packaged RTUs, and DOAS. The prevalence of these systems is shown in Figure 5 for ComStock floor area with (left) and without (right) heat/energy recovery. The applicable ComStock floor area served by AHU-based systems that do not already have heat/energy recovery is about 70% (Figure 6).
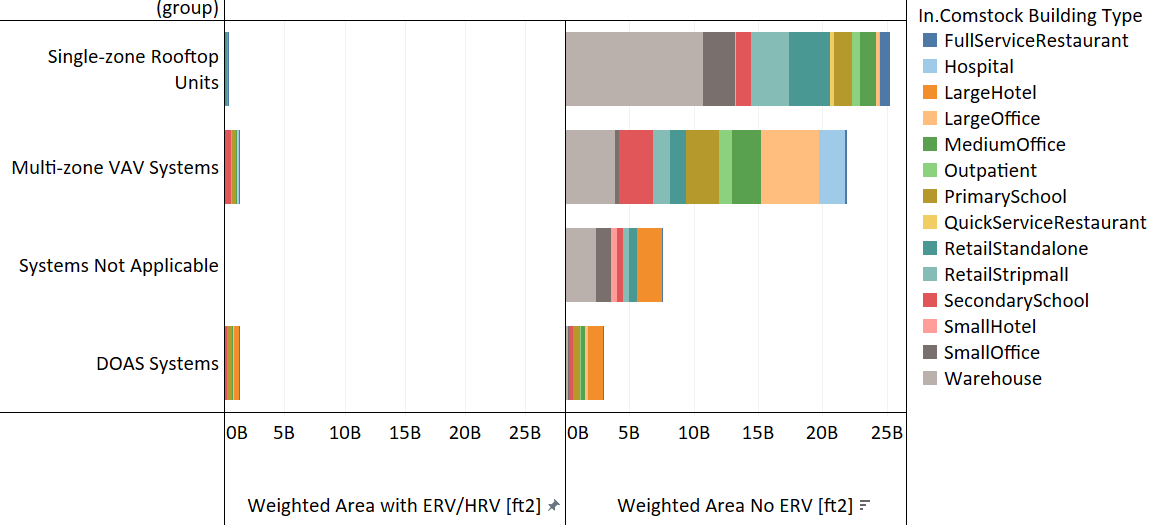
Figure 5. Weighted area of ComStock baseline by HVAC system type grouping for systems with existing ERV/HRV (not applicable to measure) and without heat/energy recovery (applicable to measure)
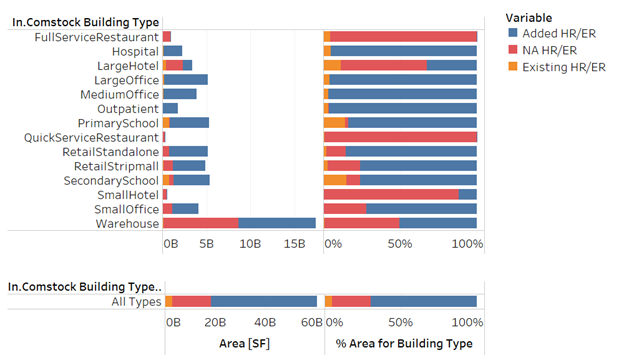
Figure 6. Summary of heat/energy recovery measure applicability for each building type
Existing HR/ER: Floor area with current heat/energy recovery systems. NA HR/ER: Floor area without energy/heat recovery, not upgradeable with this measure. Added HR/ER: Floor area served by systems upgraded with heat/energy recovery as part of this measure.
4.6 Greenhouse Gas Emissions
Three electricity grid scenarios are presented to compare the emissions of the ComStock baseline and the HP-RTU + ASHP Boiler + DCV + HR + Economizers scenario. The choice of grid scenario will impact the grid emissions factors used in the simulation, which determines the corresponding emissions produced per kilowatt-hour. Two scenarios—Long-Run Marginal Emissions Rate (LRMER) High Renewable Energy (RE) Cost 15-Year and LRMER Low RE Cost 15-Year—use the Cambium data set, and the last uses the Emissions & Generation Resource Integrated Database (eGRID) data set [6], [7]. All three scenarios vary the emissions factors geospatially to reflect the variation in grid resources used to produce electricity across the United States. The Cambium data sets also vary emissions factors seasonally and by time of day. This study does not imply a preference for any particular grid emissions scenario, but other analysis suggests that the choice of grid emissions scenario can impact results [8] . Emissions due to on-site combustion of fossil fuels use the emissions factors shown in Table 6, which are from Table 7.1.2(1) of the draft American National Standards Institute/Residential Energy Services Network/International Code Council 301 [9]. To compare total emissions due to both on-site fossil fuel consumption and grid electricity generation, the emissions from a single electricity grid scenario should be combined with all three on-site fossil fuel emissions.
Table 6. On-Site Fossil Fuel Emissions Factors
 a lb = pound; MMBtu = million British thermal units; kg = kilogram; MWh = megawatt-hour
4.7. Limitations and Concerns
In general, real buildings may have limitations beyond what has been included in the upgrades’ applicability criteria that could affect the upgrade results. The following subsections detail the limitations and concerns for the two heat pump upgrades.
4.7.1. Heat Pump Rooftop Unit
Limited comprehensive heat pump performance maps exist, which are required for detailed energy modeling. Consequently, understanding of heat pump performance and operation in this work is also limited. Heat pump modeling is sensitive to performance assumptions due to the strong relationship between efficiency and capacity with outdoor air temperature. This impacts both annual energy consumption and peak demand. This work attempts to use the most informative data available and makes documented assumptions about heat pump operation and performance. These will notably impact results. Please consider these assumptions.
Stock savings are sensitive to ComStock baseline assumptions. Compared to CBECS 2012, which is another prominent data source for commercial building stock energy usage, ComStock currently shows lower gas heating consumption and higher electric heating consumption [10]. This can affect the net impact of converting both gas furnace and electric resistance RTUs to HP-RTUs.
Lastly, there is a known EnergyPlus bug regarding cycling operation for multispeed coil objects. This can cause the modeled HP-RTU systems to cycle at higher part-load fractions than the baseline single-speed RTU systems. Many units are only minimally impacted by this since the HP-RTU systems are variable speed and can turn down to lower part-load fractions.
4.7.2. Air-Source Heat Pump Boiler
Some of the boilers in the baseline ComStock models do not have minimum load turndown control. This allows a small flow with insignificant heating in the hot water loop. This had a negative impact during the application of this upgrade, as the upgrade introduces a heat pump loop that is triggered by a nonzero flow in the hot water loop. The small flow in the hot water loop forces the heat pump to cycle frequently and eventually affects the expected savings from the application of this upgrade. This issue should be addressed in the next version of the ComStock models.
Another limitation is the current version of the heat pump object used in this upgrade, the plant loop energy input ratio heating heat pump. This object is a constant flow model that requests full design flow from the plant. This limits the ability to model variable speed heat pumps and forces the heat pump to cycle more. This upgrade should be updated in the future once the updated version of the heat pump object with a variable speed option is available.
4.7.3. Economizers
In the current version of ComStock, two faults related to the economizers are implemented in the “baseline” simulations: incorrect changeover (high limit) temperature fault for fixed dry-bulb control and damper fully closed fault. Assumptions (detailed in the ComStock Reference Documentation [2]) such as fault prevalence, fault incidence, fault intensity, etc., are made to reflect differences between different faults. While these two faults are reflected in the baseline simulations, we made a judgement to include damper fully closed fault in upgrade simulations as well. We are assuming that the incorrect changeover temperature fault that is mostly caused by poor commissioning is minimized (i.e., not included in upgrade simulations) by best practices conducted in the latest market. However, the fully damper closed fault that is initially and automatically triggered by malfunctioning or broken damper linkage is considered as an inherent probabilistic issue even with the new economizer upgrade.
Although faults (e.g., damper fully closed) are implemented with fixed prevalence (e.g., 35%), the actual percentage of economizers being faulted (among applicable economizers) is less than the defined prevalence due to current implementation limitation. For example, 35% of randomly selected buildings that include certain HVAC system types (that are categorized as the air system) are assigned to have the damper fully closed fault. However, there are cases where these air systems assigned to have an economizer fault do not even qualify to have an economizer when the cooling capacity is below a certain threshold (defined by the energy code). In other words, the current limitation is that the random selection of faulted economizers is not fully aligned with buildings that actually have economizers. In this case, we are losing a sample that is selected by 35% prevalence, resulting in decreased representation of fault prevalence in the final building stock. Additional to sampling limitations, another limitation is that the economizer faults are currently not applied to packaged single zone systems due to incorrect applicability implementation.
In reality, California’s Title 24 energy code requires fault detection and diagnostics for economizers, which prevents and quickly mitigates some but not all faults that can occur in economizers. However, the current version of ComStock does not reflect the preventative or quickly resolving fault detection and diagnostics methodologies, thus possibly overestimating the degraded impact of faults in buildings in California.
While the representation of faults in this upgrade is underestimated due to the limitation described above, it should be noted that the savings shown in the results still reflect the impact of faults. For example, a newly added economizer through an upgrade has a chance (less than 35%) of having a damper closed fault for a month in a year. If the outdoor air conditioning was favorable (or unfavorable) for economizing during the faulted period, then the fault causes negative (or positive) impact on energy savings through the upgrade. Note that the fully closed damper fault impacts both negatively and positively on the energy consumption, while the positive energy savings by not introducing (hotter) outside air cause indoor air quality issues.
As not all buildings are configured in the same way and in the optimal way, our building models include variability between models. For example, depending on the HVAC system and building type, we have RTUs that either (1) run fans along with ventilation over the entire night, (2) only cycle fans (with ventilation) based on thermostat settings, or (3) only cycle fans (without ventilation) based on thermostat settings. When an economizer upgrade is applied to a building that initially has RTU with option #1, the current modeling workflow implements the economizer in an unreasonable way. One example is a building with a RTU serving a single zone where, in the baseline, a fixed positioned outdoor air damper in the RTU always provides a certain fraction of fresh air into the building overnight. When the economizer upgrade is applied, now the economizer tries to introduce outdoor air based on mixed air temperature setpoint. In these buildings showing negative heating savings, the economizer is bringing much more outdoor air (compared to the baseline model) when the outside is cold, resulting is overcooled indoor spaces where the zone temperatures fall below the heating setpoint of occupied hours (but still higher than setback heating setpoint). Thus, in the beginning of the day, heating systems start to operate to maintain heating setpoint. This issue is not considered as a common phenomenon in the field; improvement will be made in future analyses.
4.7.4. Demand Control Ventilation
There is one notable model group excluded from ComStock’s baseline DCV application: offices. We expect to see especially high energy savings from this measure in this group. It is important to note that these savings numbers are likely overestimates, as many of the actual buildings in this group use DCV.
4.7.5. Exhaust Air Heat/Energy Recovery
The most prominent limitation of this study is a lack of data on the prevalence of once-through air delivery systems that do not exhaust air at the AHU, but rather through a dedicated exhaust fan. This complicates adding a heat/energy recovery system because the exhaust air and outdoor ventilation air need to pass through the same heat exchanger to achieve energy recovery benefits. If air is exhausted across multiple separate locations, additional work may be required to route the airstreams to the same location. Otherwise, the portion of exhaust air not passing through the heat/energy recovery system will not be utilized for energy recovery, which can limit the effectiveness of the system.
ComStock does account for zone exhaust fans in some building types, but not in offices, retail buildings, or warehouses, which are prominent building types. Furthermore, ComStock does not currently account for duct leakage. A PNNL study using the DOE prototype models assumes that 90% of exhaust air is available for energy recovery to account for both zone exhaust and duct losses [11]. To account for this, the energy/heat recovery measure assumes that 90% of return air is available for recovery. However, it is unclear how realistic this assumption is, and how it might vary between buildings, which can impact the savings of this measure. Overestimating the return air fraction would increase the savings suggested by this measure.
Lastly, the prevalence of heat/energy recovery in ComStock baseline AHUs is based on code requirements for the HVAC code year of each model. However, no data sources were found to validate the fraction of floor area of the building stock against what ComStock assumes using the code-baseline methodology. Heat/energy recovery prevalence impacts the measure savings, as heat/energy recovery prevalence in existing AHUs is inversely proportional to the number of applicable AHUs for the measure and therefore the stock-level savings achieved from the measure. Moreover, heat and energy recovery code requirements frequently depend on the size of the system. ComStock relies on assumptions about zoning to determine system size, but inaccuracies in these assumptions can result in inaccuracies in estimating the potential applicability of adding heat/energy recovery to systems that do not already include it.
5. Output Variables
Table 7 includes a list of output variables that are calculated in ComStock by the upgrades included in this upgrade package. These variables are important in terms of understanding the differences between buildings with and without the HP-RTU + ASHP Boiler + DCV + HR + Economizers upgrade package applied. These output variables can also be used for understanding the economics of the upgrades (e.g., return on investment) if cost information (i.e., material, labor, and maintenance costs for technology implementation) is available.
Table 7. Output Variables Calculated From the Upgrade Applications
| Upgrade | Variable Name | Description |
|---|---|---|
| HP-RTU | stat.hvac_count_dx_cooling_XX_to_XX_kbtuh | Total number of direct expansion (DX) cooling units within a size bin |
| stat.hvac_count_dx_heating_XX_to_XX_kbtuh | Total number of DX heating units within a size bin | |
| stat.hvac_count_heat_pumps_XX_to_XX_kbtuh | Total number of heat pump units within a size bin | |
| stat.dx_cooling_average_cop..COP | Average operational COP (compressor only) of DX cooling models during simulation | |
| stat.dx_cooling_capacity_tons..tons | Total tons of DX cooling modeled | |
| stat.dx_cooling_design_cop..COP | Average rated (compressor only) COP of DX cooling units at rated conditions | |
| stat.dx_heating_average_cop..COP | Average operational COP (compressor only) of DX cooling models during simulation | |
| stat.dx_heating_average_minimum_operating_temperature..C | Average compressor minimum heating lockout temperature, below which the heat pump heating will be disabled (°C) | |
| stat.dx_heating_average_total_cop..COP | Average effective COP of DX heating. This includes energy from the defrost cycle and any supplemental heating | |
| stat.dx_heating_capacity_at_XXF..kBtu_per_hr | Average available heat pump capacity at a given temperature (kBtu/h) | |
| stat.dx_heating_capacity_at_rated..kBtu_per_hr | Average available heat pump capacity at rated temperature (47°F) | |
| stat.dx_heating_design_cop..COP | Average design COP of heat pumps | |
| stat.dx_heating_design_cop_XXf..COP | Heat pump COP at given temperature, or rated conditions (47°F) | |
| stat.dx_heating_fraction_electric_defrost | Fraction of heat pump electric defrost energy to DX heating energy | |
| stat.dx_heating_fraction_electric_supplemental | Fraction of heat pump electric supplemental heating energy to DX heating energy | |
| stat.dx_heating_supplemental_capacity_electric..kBtu_per_hr | Electric coil supplemental heating capacity (kBtu/h) | |
| stat.dx_heating_supplemental_capacity_gas..kBtu_per_hr | Gas coil supplemental heating capacity (kBtu/h) | |
| stat.dx_heating_supplemental_capacity..kBtu_per_hr | Total (gas or electric) supplemental heating capacity (kBtu/h) | |
| stat.dx_heating_fraction_supplemental | Fraction of heat pump heating energy from supplemental heating | |
| stat.dx_heating_total_dx_electric..J | Total heat pump heating electric load (J) | |
| stat.dx_heating_total_dx_load..J | Total heat pump heating load (J) | |
| stat.dx_heating_total_load..J | Total heat pump system heating load (J) | |
| stat.dx_heating_total_supplemental_load_gas..J | Total heating output energy from gas supplemental coil (J) | |
| stat.dx_heating_total_supplemental_load_electric..J | Total heating output energy from electric supplemental coil (J) | |
| stat.dx_heating_defrost_energy..kBtu | Total heat pump electricity energy for defrost (kBtu) | |
| stat.dx_heating_ratio_defrost | Ratio of heat pump defrost electricity to heat pump heating energy | |
| stat.hours_below_XXF..hr | Number of hours below given outdoor air temperature during simulation | |
| ASHP Boiler | Heat pump capacity weighted design COP | COP of the heat pump at the rated design conditions |
| Heat pump average COP | Average heat pump COP | |
| Heat pump total load | Total heating provided by heat pump (J) | |
| Boiler total load | Total heating provided by boiler (J) | |
| Heat pump total electricity | Total electricity consumption by heat pump (J) | |
| Boiler total electricity | Total electricity consumption by boiler (J) | |
| Heat pump capacity | Heat pump capacity (kBtu/h) | |
| Count heat pumps | Count of heat pumps | |
| Count heat pumps 0–300 kBtuh | Count of heat pumps in the range of 0–300 kBtu/h capacity | |
| Count heat pumps 300–2,500 kBtuh | Count of heat pumps in the range of 300–2,500 kBtu/h capacity | |
| Count heat pumps 2,500+ kBtuh | Count of heat pumps with more than 2,500 kBtu/h capacity | |
| Hot water loop total load | Total heating load in the hot water loop (J) | |
| Hot water loop boiler fraction | Fraction of heating load provided by boiler | |
| Hot water loop heat pump fraction | Fraction of heating load provided by heat pump | |
| Economizers | area_fraction_with_economizer | Total area covered by HVAC system with economizer |
| num_air_loops_economizer | Total number of economizers in the building HVAC systems | |
| average_outdoor_air_fraction | Weighted (based on mass flow rate) average outdoor air fraction | |
| economizer_control_type | Dominant economizer control type in the building with respect to airflow | |
| economizer_high_limit_temperature..c | Economizer highlimit (temperature [oC]) for fixed dry-bulb control. -999 for a building without highlimit | |
| economizer_high_limit_enthalpy..j_per_kg | Economizer highlimit (enthalpy [J/kg]) for fixed enthalpy control. -999 for a building without highlimit. | |
| Demand Control Ventilation | Initial condition | Number of air loops with DCV before the measure is applied |
| Final condition | Number of air loops with DCV after the measure is applied | |
| Exhaust Air Heat/Energy Recovery | stat.area_fraction_with_heat_recovery | Fraction of model floor area served by an AHU with heat/energy recovery |
| stat.num_air_loops_heat_recovery | Number of airloops with heat/energy recovery in model (unweighted) | |
| stat.num_air_loops | Number of airloops in model (unweighted) |
6. Results
In this section, results are presented both at the stock level and for individual buildings through savings distributions. Stock-level results include the combined impact of all the analyzed buildings in ComStock, including buildings that are not applicable to this upgrade. Therefore, they do not necessarily represent the energy savings of a particular or average building. Stock-level results should not be interpreted as the savings that a building might realize by implementing the HP-RTU + ASHP Boiler + DCV + HR + Economizers upgrade package.
Total site energy savings are also presented in this section. Total site energy savings can be a useful metric, especially for quality assurance/quality control, but this metric on its own can have limitations for drawing conclusions. Further context should be considered, as site energy savings alone do not necessarily translate proportionally to savings for a particular fuel type (e.g., gas or electricity), source energy savings, cost savings, or greenhouse gas savings. This is especially important when an upgrade impacts multiple fuel types or causes decreased consumption of one fuel type and increased consumption of another. Many factors should be considered when analyzing the impact of an energy efficiency or electrification strategy, depending on the use case.
6.1. Realized Applicability
Figure 7 provides a breakdown of the applicability of the HP-RTU + ASHP Boiler + DCV + HR + Economizers package by individual measure. The individual component measures were applicable to between 29% and 78% of the stock floor area. Heat Recovery had the highest applicability at 78%. The ASHP-Boiler measure had the lowest applicability at 29% of the floor area, which is to be expected because of the prevalence of boilers in the baseline.
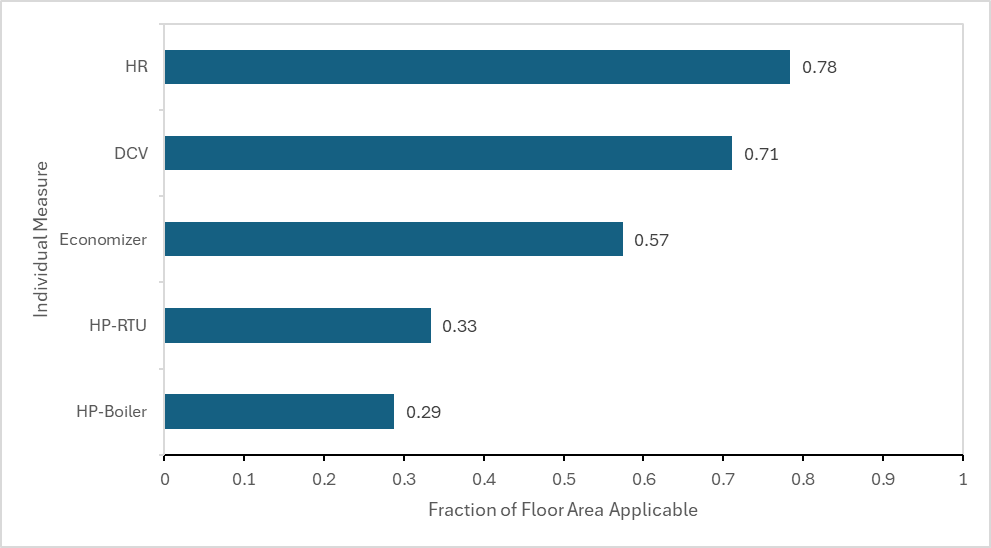
Figure 7. Applicability for the HP-RTU + ASHP Boiler + DCV + HR + Economizers package by individual measure
The package was applicable to 85% of the stock floor area, meaning at least one measure was applicable. Approximately 15% of the stock was not applicable to any of the five measures. Figure 8 shows the measure combinations with the highest applicability by fraction of total floor area. The most common combination of measures was the HP-RTU retrofit + DCV + Heat Recovery + Economizers, which was applicable to 31% of the stock by floor area. There were 15 additional measure combinations observed in the results that are not shown, but each were applicable to under 2% of the stock by floor area.
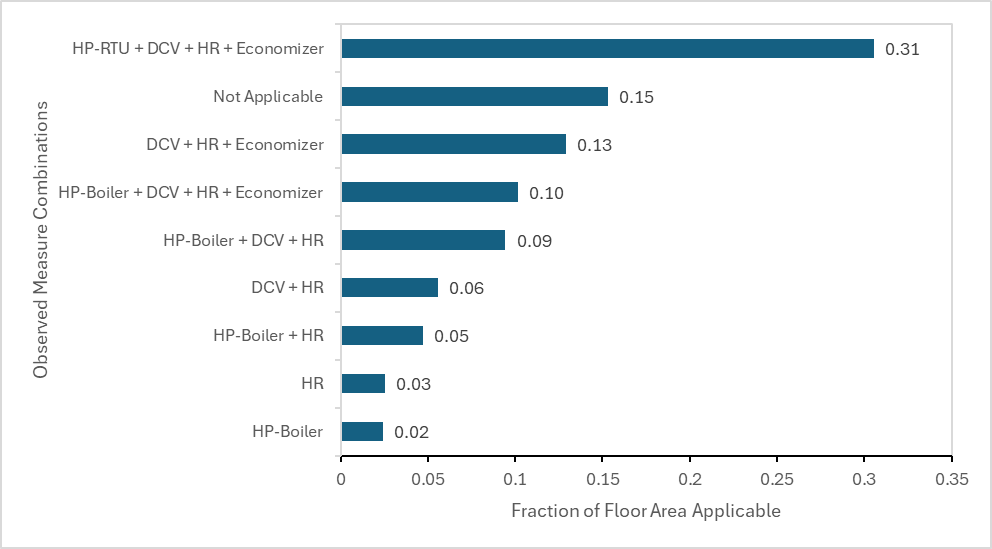
Figure 8. Top observed measure combinations for the HP-RTU + ASHP Boiler + DCV + HR + Economizers package
6.2. Stock Energy Impacts
The HP-RTU + ASHP Boiler + DCV + HR + Economizers package demonstrates 19.8% total site energy savings (857 trillion British thermal units [TBtu]) for the U.S. commercial building stock modeled in ComStock (Figure 9). The savings are a result of electrification of gas-furnace and boiler systems, which are then combined with efficiency upgrades like DCV, Heat/Energy Recovery, and Economizers:
-
86.7% stock heating gas savings (740.8 TBtu)
-
-84.9% stock heating electricity savings (-148.7 TBtu)
-
21.8% stock cooling electricity savings (145.5 TBtu)
-
18.6% stock fan electricity savings (96.5 TBtu).
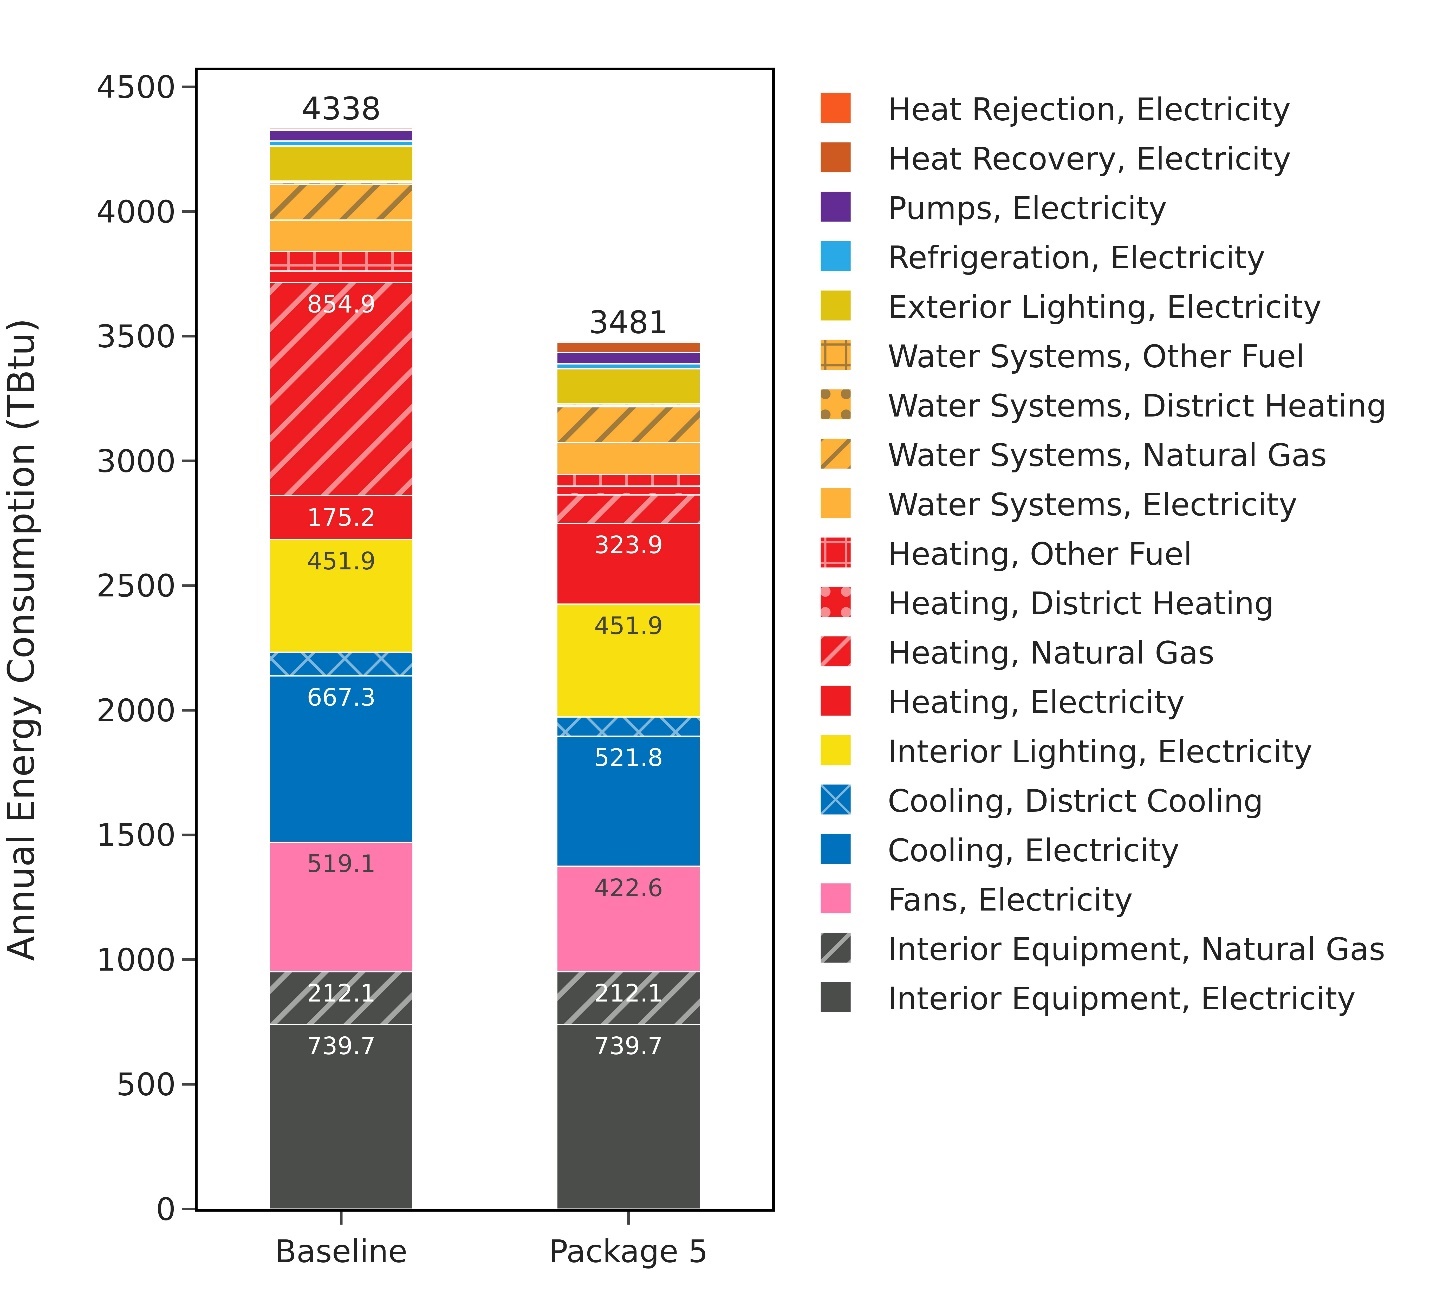
Figure 9. Comparison of annual site energy consumption between the ComStock baseline and the HP-RTU + ASHP Boiler + DCV + HR + Economizers (Package 5) scenario
Energy consumption is categorized both by fuel type and end use.
The HP-RTU + ASHP Boiler + DCV + HR + Economizers package is made up of five different HVAC measures, which results in measure interaction and compounding energy savings. While it is difficult to extract the savings attributed to each individual measure from the stock level results, we have an idea of what impacts each of the five measures should have on the results. This helps us validate that the savings we see from the full package are reasonable and as expected.
-
HP-RTU: This measure electrifies natural gas heating in RTU systems, so we expect large natural gas heating savings (up to 50%) and heating electricity penalties. The measure also replaces electric resistance RTUs with higher efficiency heat pumps, so in those cases we see electric heating savings. These somewhat offset the electric heating penalties from buildings that started with natural gas heating, so the stock heating electricity penalty is expected to be no larger than 5%. We can also expect cooling and fan savings around 15%–25% due to replacing the existing cooling system with a higher efficiency heat pump.
-
ASHP-Boiler: This measure electrifies gas boiler systems, so we expect large natural gas heating savings (up to 50%) and heating electricity penalties (up to 35%). The buildings this measure applies to tend to be larger buildings that make up a small portion of the stock by number of buildings but a more substantial portion of the stock by energy consumption. This building does not affect cooling or fan end uses, but we can expect some increases in pump energy due to the installation of the heat pump, although pump energy makes up a very small portion of the annual site energy.
-
DCV: This measure reduces outdoor air intake during periods of reduced occupancy, resulting in heating and cooling savings during those times. We can expect up to 10% heating savings and up to 5% cooling savings as a result of the implementation of DCV. When combined with economizing, we may expect higher cooling savings because the technologies will work together to ensure the DCV is not reducing outdoor air if it is beneficial for cooling.
-
Exhaust Air Heat/Energy Recovery: This measure installs heat/energy recovery systems which precondition outdoor ventilation air using exhaust air. This measure reduces the loads on heating and cooling coils, so we can expect up to 25% heating savings and up to 10% cooling savings at the stock level. We can also expect an increase in energy recovery end use; however, this makes up a very small portion of the annual stock site energy.
-
Economizers: This measure implements economizing in buildings that do not already have it, enabling the spaces to leverage colder outdoor air when it is beneficial for cooling. We expect this measure to primarily impact cooling end uses with up to 5% savings. There could be small heating penalties (<1%) as a result of this measure. Because economizing is already required by energy codes in some climates, the expected energy savings for this measure are lower than others in the package. However, when combined with the other HVAC measures in the package, there could be larger impacts.
When combining all five of these HVAC measures together, we see impressive stock-level savings of 19.8%. The two heat pump measures electrify 87% of the natural gas heating end use but add substantial electric heating loads. This large reduction in natural gas heating is possible because the HVAC systems that receive either the HP-RTU measure or ASHP-Boiler measure make up 62% of the ComStock floor area but 91% of the stock natural gas heating end use. The heat pumps also result in cooling savings due to the addition of a more efficient cooling system. When DCV, Heat/Energy Recovery, and Economizers are added after the heat pump measures, they result in additional cooling and fan savings as well as a reduced electric heating penalty at the stock level. In addition, there were changes in the heat recovery and pump end uses as discussed above, although these make up a small portion of the stock energy.
6.3. Stock Greenhouse Gas Emissions Impact
ComStock simulation results show greenhouse gas emissions avoided across all electricity grid scenarios for all on-site combustion fuel types (Figure 10). The overall emissions across all fuels saw a decrease of 14%–20% (49–56 million tons of CO2e) between the three scenarios. This package results in 62% (50 million tons of CO2e) avoided natural gas emissions compared to the ComStock baseline. The natural gas results remain consistent across all three grid scenarios, as these scenarios exclusively pertain to modifications within the electricity grid, without affecting natural gas outcomes. Electricity greenhouse gas emissions avoided from the electricity grid vary depending on the scenario chosen; some scenarios show increased electricity emissions and others show reduced electricity emissions. This is because the scenarios project different levels of renewable energy penetration to the grid. The LRMER Low RE scenario shows a 3 MMT CO2e increase in electricity emissions, while the LRMER High RE and eGRID scenarios show 1-4 MMT CO2e of avoided greenhouse gas emissions from the electricity grid.
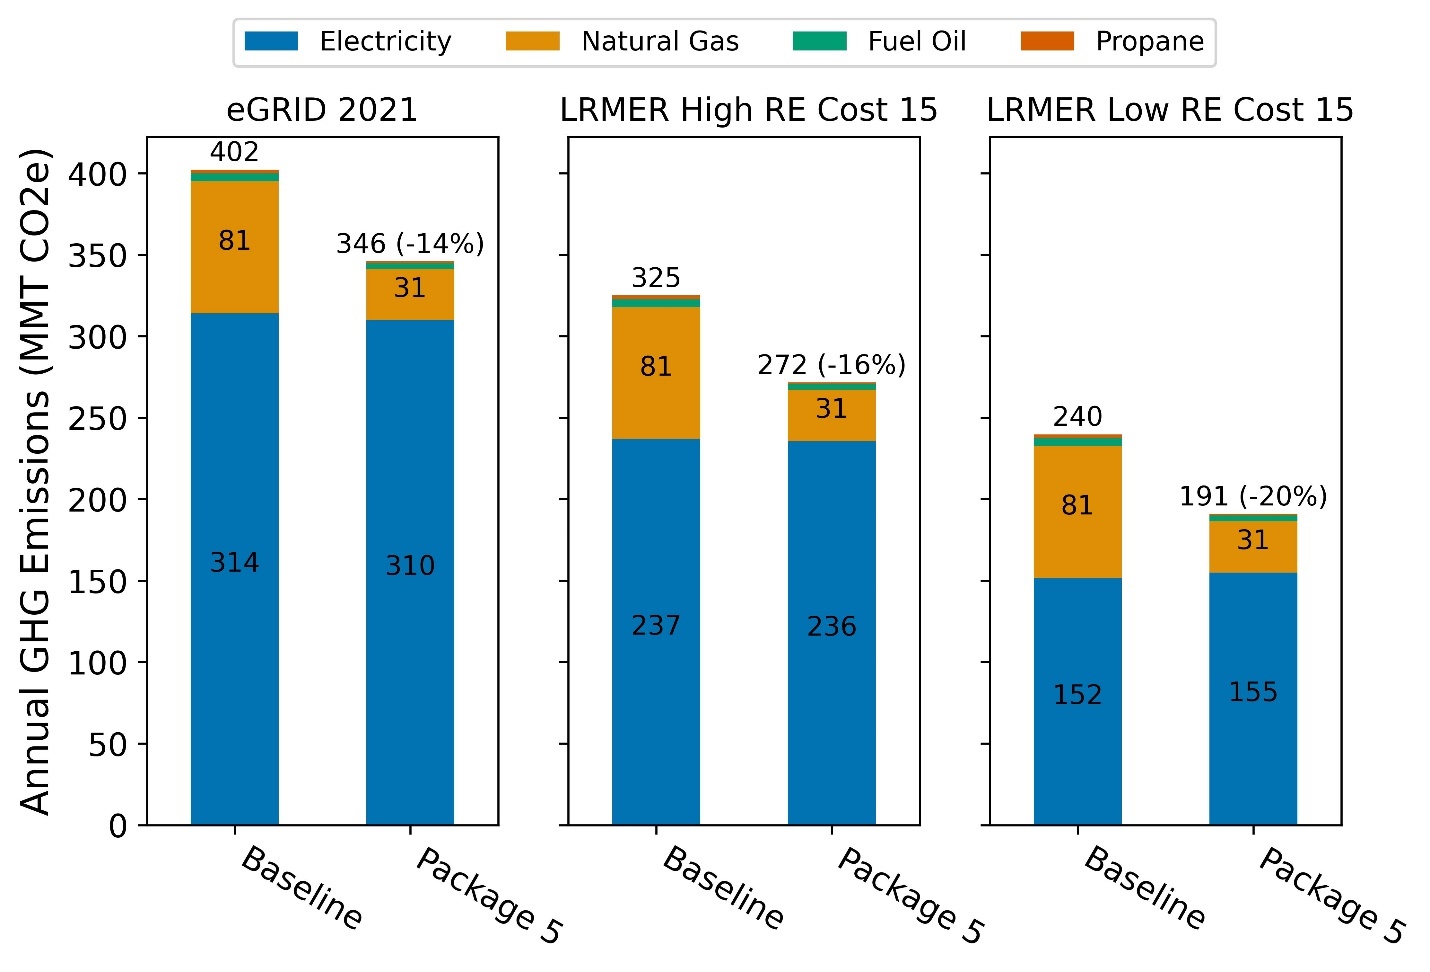
Figure 10. Greenhouse gas emissions comparison of the ComStock baseline and the HP-RTU + ASHP Boiler + DCV + HR + Economizers (Package 5) scenario
Three electricity grid scenarios are presented: Cambium Long-Run Marginal Emissions Rate (LRMER) High Renewable Energy (RE) Cost 15-Year, Cambium LRMER Low RE Cost 15-Year, and eGRID. MMT stands for million metric tons.
6.4. Site Energy Savings Distributions
This section discusses site energy consumption for quality assurance/quality control purposes. Note that site energy savings can be useful for these purposes, but other factors should be considered when drawing conclusions, as they do not necessarily translate proportionally to source energy savings, greenhouse gas emissions avoided, or energy cost.
Figure 11 shows the percent savings distributions of the baseline ComStock models versus the HP-RTU + ASHP Boiler + DCV + HR + Economizers scenario by end use and fuel type for applicable models. In other words, each data point in the distribution represents the percent energy savings between a baseline ComStock model and the corresponding upgrade model with measures applied.
Most of the savings for the “Other Fuel Heating” and “Natural Gas Heating” categories are at 100% owing to replacing the combustion fuel-based system in the baseline with an all-electric heat pump system in the HP-RTU + ASHP Boiler + DCV + HR + Economizers scenario.
Some models unintuitively show “Natural Gas Heating” and “Other Fuel” heating penalties. Closer investigation shows that these models are exclusively “PVAV with gas heat with electric reheat,” which did not receive the heat pump upgrades and only received one or more of the DCV, Heat/Energy Recovery, or Economizer upgrades. For this system type, the efficiency measures applied must have had a negative effect on heating loads. However, upon looking at site energy savings for this system type only, there are still positive site energy savings, meaning cooling savings have more than offset the heating penalty.
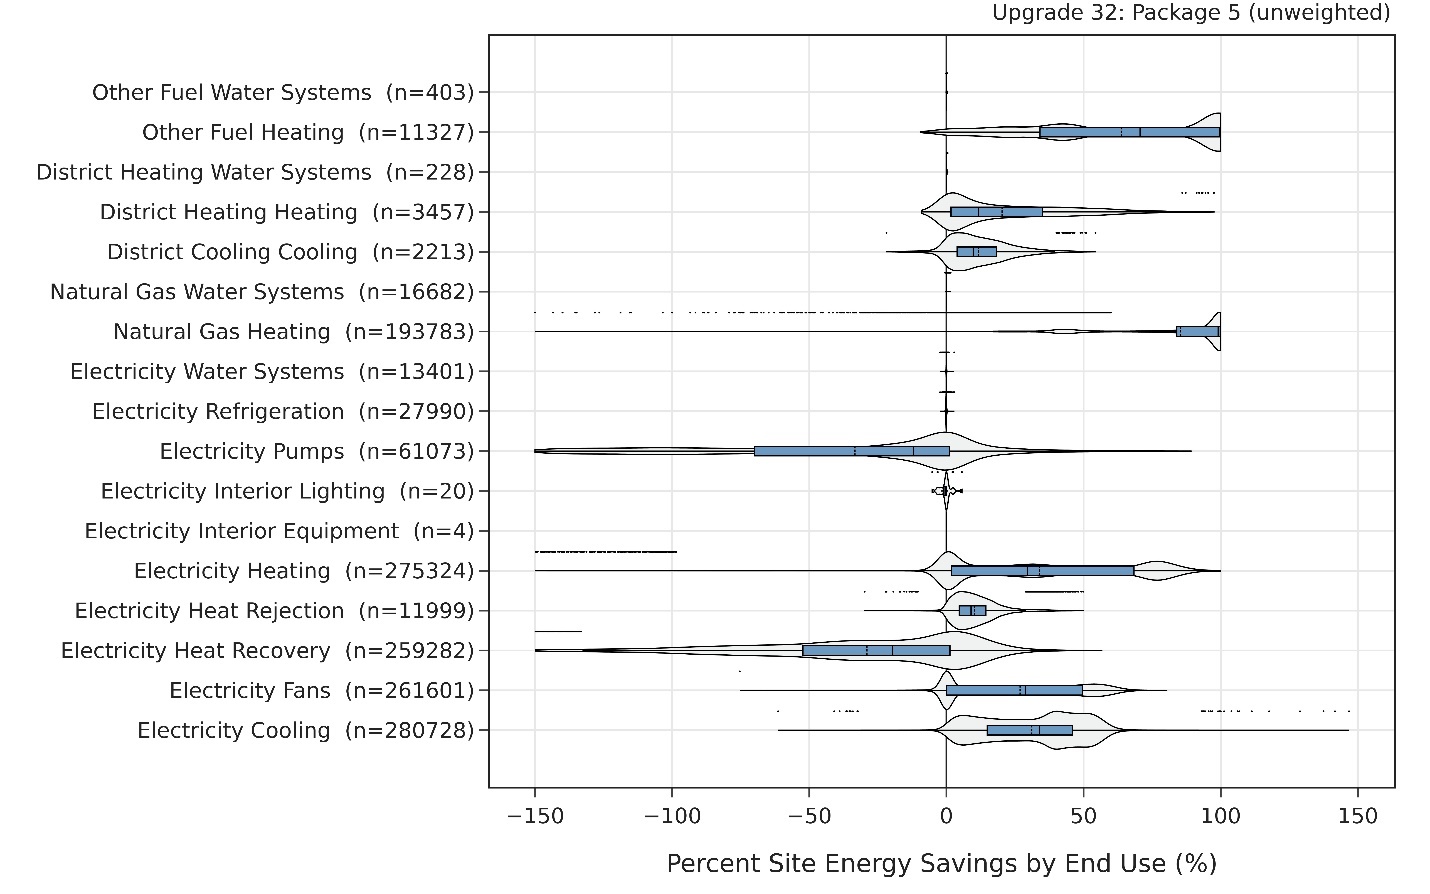
Figure 11. Percent site energy savings distribution for ComStock models with the HP-RTU + ASHP Boiler + DCV + HR + Economizers package (Package 5) applied by end use and fuel type
The data points that appear above some of the distributions indicate outliers in the distribution, meaning they fall outside 1.5 times the interquartile range. The value for n indicates the number of ComStock models that were applicable for energy savings for the fuel type category.
Pump electricity increased between the baseline and upgrade scenario, as expected, due to the addition of heat pump boilers to some models. This measure adds an additional circulation pump to the heat pump loop, increasing the required pump power. In addition, the ASHP boiler system operates at a lower supply temperature than the existing gas boiler it is replacing, which increases the required loop flow rate. Both factors can increase pumping energy.
Most buildings saw heating, cooling, and fan electricity savings due to higher efficiency performance of HP-RTUs compared with traditional RTUs, combined with the additional efficiency measures applied. However, some models saw heating electricity penalties. If a building began with 100% natural gas heating and was converted to 100% electric heating, it is not shown on Figure 11 in the electric heating end use row, as the electric heating penalty would be infinity. Rather, the buildings showing an electric heating penalty are ones that started with mostly natural gas heating but some small portion of electric resistance heating (such as electric baseboards in a vestibule). When those buildings were converted to fully electric heating via a heat pump, the electric heating penalty becomes very large. In most buildings that began with some electric heating, the addition of the heat pump resulted in positive energy savings, with a median around 30% savings.
Some models show negative heat recovery savings, noting that the heat recovery end use is for electricity used to operate enthalpy wheels. Additionally, the heat recovery end use includes added fan energy needed to overcome the heat exchanger. The negative energy savings are due to increased prevalence of heat recovery from the measure package, noting that this penalty is generally made up for in heating and cooling savings. However, the heat recovery end use makes up a very small portion of building stock energy usage (as was seen in Figure 9), so negative percentage savings in this end use has minimal impact.
Minimal differences are observed for water systems, refrigeration, interior lighting, and interior equipment, as these systems are not directly impacted by the upgrade package. However, some buildings show minor changes due only to subtle differences in ambient air temperature that affect the operation of these systems. The interior lighting end use shows a small number of samples with savings/penalties as a result of applying this measure scenario. This is a known bug in the workflow as this measure does not impact the lighting end use. However, this bug affects very few buildings and therefore the impact is minimal.
Figure 12 shows the site energy savings distributions between the ComStock baseline and the HP-RTU + ASHP Boiler + DCV + HR + Economizers scenario by fuel type and total site energy. The total site energy savings distribution shows savings values generally between 15% and 35% for the 25th and 75th percentiles, respectively. Combined site energy savings alone is not a comprehensive assessment of electrification measures, so other considerations should be made as well.
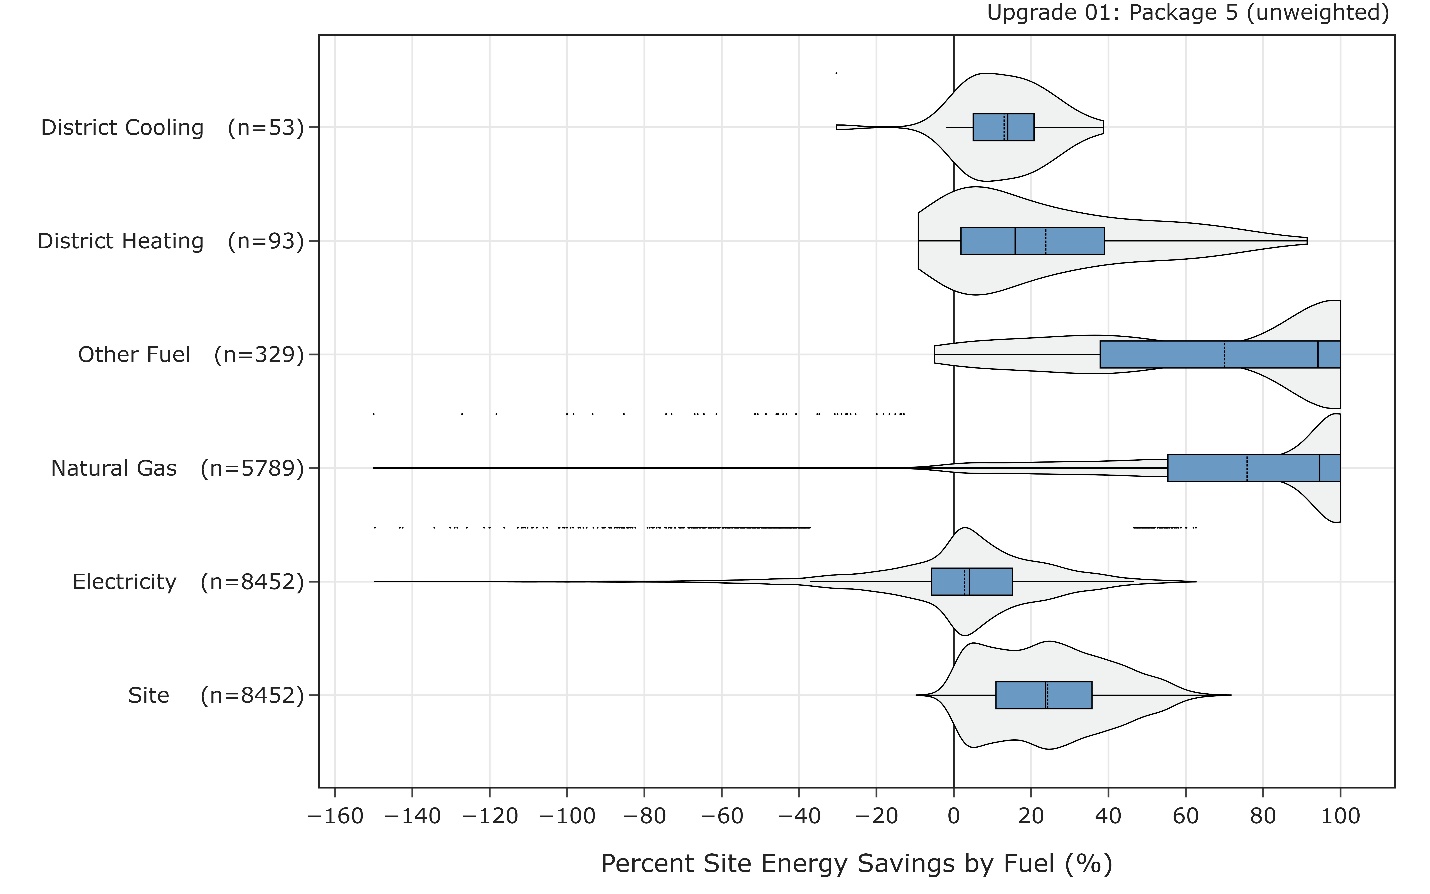
Figure 12. Percent site energy savings distribution for ComStock models with the applied HP-RTU + ASHP Boiler + DCV + HR + Economizers package (Package 5) by fuel type
The data points that appear above some of the distributions indicate outliers in the distribution, meaning they fall outside 1.5 times the interquartile range. The value for n indicates the number of ComStock models that were applicable for energy savings for the fuel type category.
The site electricity distribution shows some energy penalties. These are mostly buildings that changed from gas heat to electric heat, so the penalties are expected, noting that these buildings likely show reductions in other heating fuel types that were electrified. Some of this electricity penalty is reduced or mitigated through savings for cooling, fans, and heat recovery, depending on the building and its climate zone. Most of the buildings, however, show electricity savings, as a result of replacing existing systems with high-efficiency heat pumps combined with the other efficiency measures.
The “Natural Gas” and “Other Fuel” end uses show many models with near 100% savings. These are buildings that are completely electrified from the HP-RTU or ASHP Boiler measures and where gas is not used for other end uses. Models with less than 100% gas or other fuel savings generally have some nonapplicable gas HVAC system type in the baseline, or other end uses, such as water heating, that are not electrified through the HP-RTU or ASHP Boiler measures. Some models show negative natural gas site savings. As discussed earlier, this was found to be buildings that did not receive either heat pump upgrade, and the additional HVAC upgrades applied resulted in a heating penalty.
A small portion of buildings show negative site energy savings. Upon further investigation, these are almost exclusively buildings that did not receive either one of the heat pump upgrades, and only received one or more of the DCV, Heat/Energy Recovery, or Economizer upgrades. These upgrades must have had a negative impact on the site energy for these buildings, which could be related to climate zone, internal loads, or other unique aspects of those buildings.
Figure 13 shows the site energy savings distributions between the ComStock baseline and the HP-RTU + ASHP Boiler + DCV + HR + Economizers scenario by HVAC system present in the baseline building. While this package is applicable to 35 different HVAC systems, some systems got a more comprehensive upgrade than others. Buildings that began with a rooftop unit or boiler system underwent a full system swap out via the HP-RTU or ASHP Boiler measure, while other HVAC systems only received some combination of DCV, HR, and/or Economizers. The HVAC systems that show the largest site energy savings (median of 20-30% savings) after the upgrade package was applied are PSZ-AC systems and boiler systems because they were retrofitted with a heat pump, in addition to other advanced HVAC controls measures. Most other systems saw site energy savings in the range of 5-10% for the median building. A few outliers, primarily in boiler systems, saw negative site energy savings, which is a result of adding substantial electric heating load to the building.
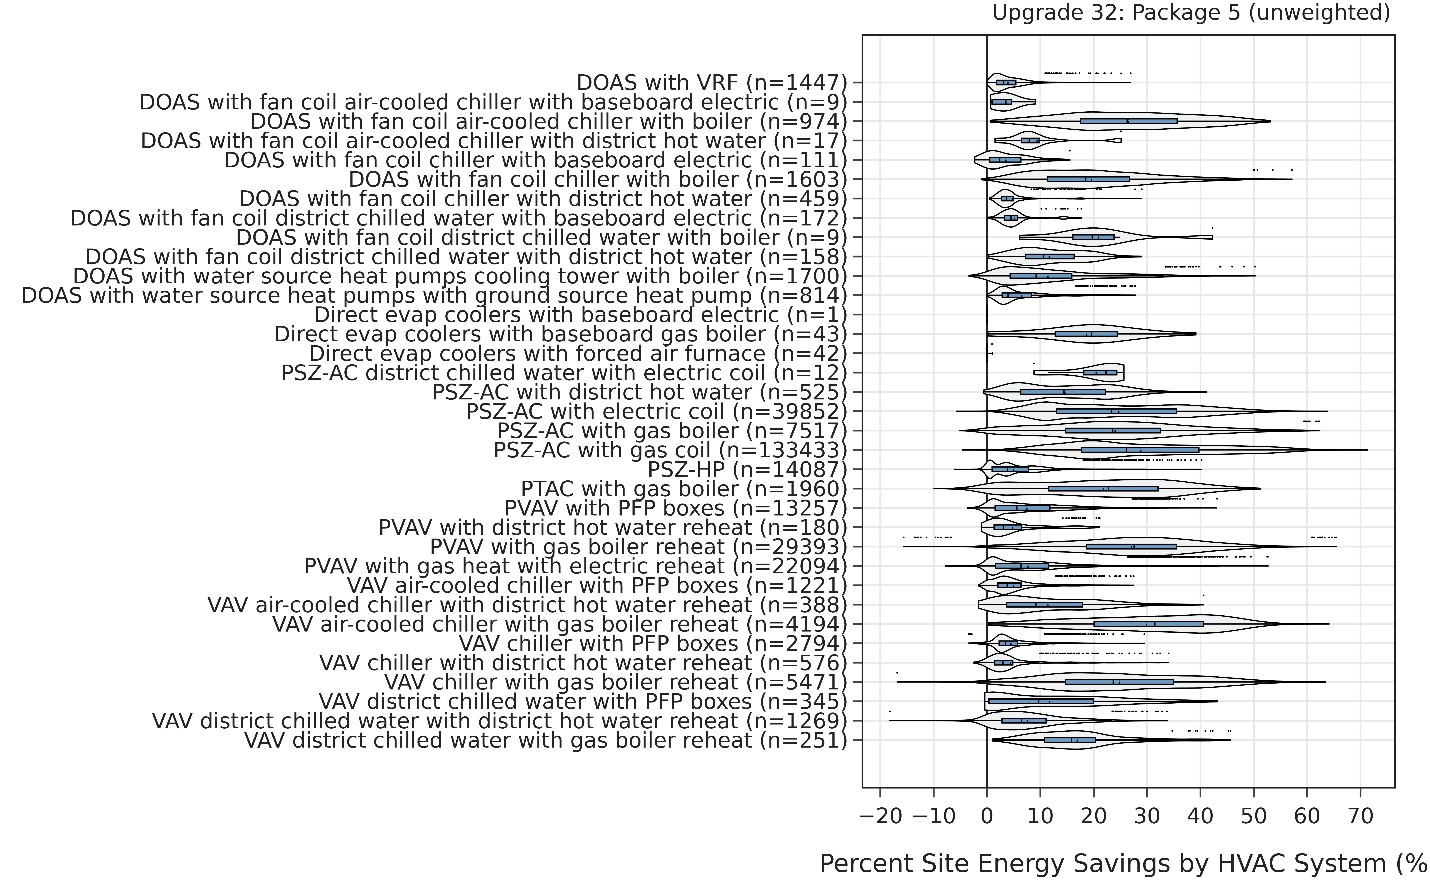
Figure 13. Percent site energy savings distribution for ComStock models with the applied HP-RTU + ASHP Boiler + DCV + HR + Economizers package (Package 5) by baseline HVAC system**
The data points that appear above some of the distributions indicate outliers in the distribution, meaning they fall outside 1.5 times the interquartile range. The value for n indicates the number of ComStock models that were applicable for energy savings for the fuel type category.
6.5. Peak Impacts
Figure 14 shows the impact of the HP-RTU + ASHP Boiler + DCV + HR + Economizers package on seasonal peak timing. The median winter peak is shifted earlier in the day by 1-2 hours, as morning electric heating now has a large impact on the peak in the winter. Summer and shoulder peak distributions moved slightly earlier in the day, but not to the extent of the winter peak.
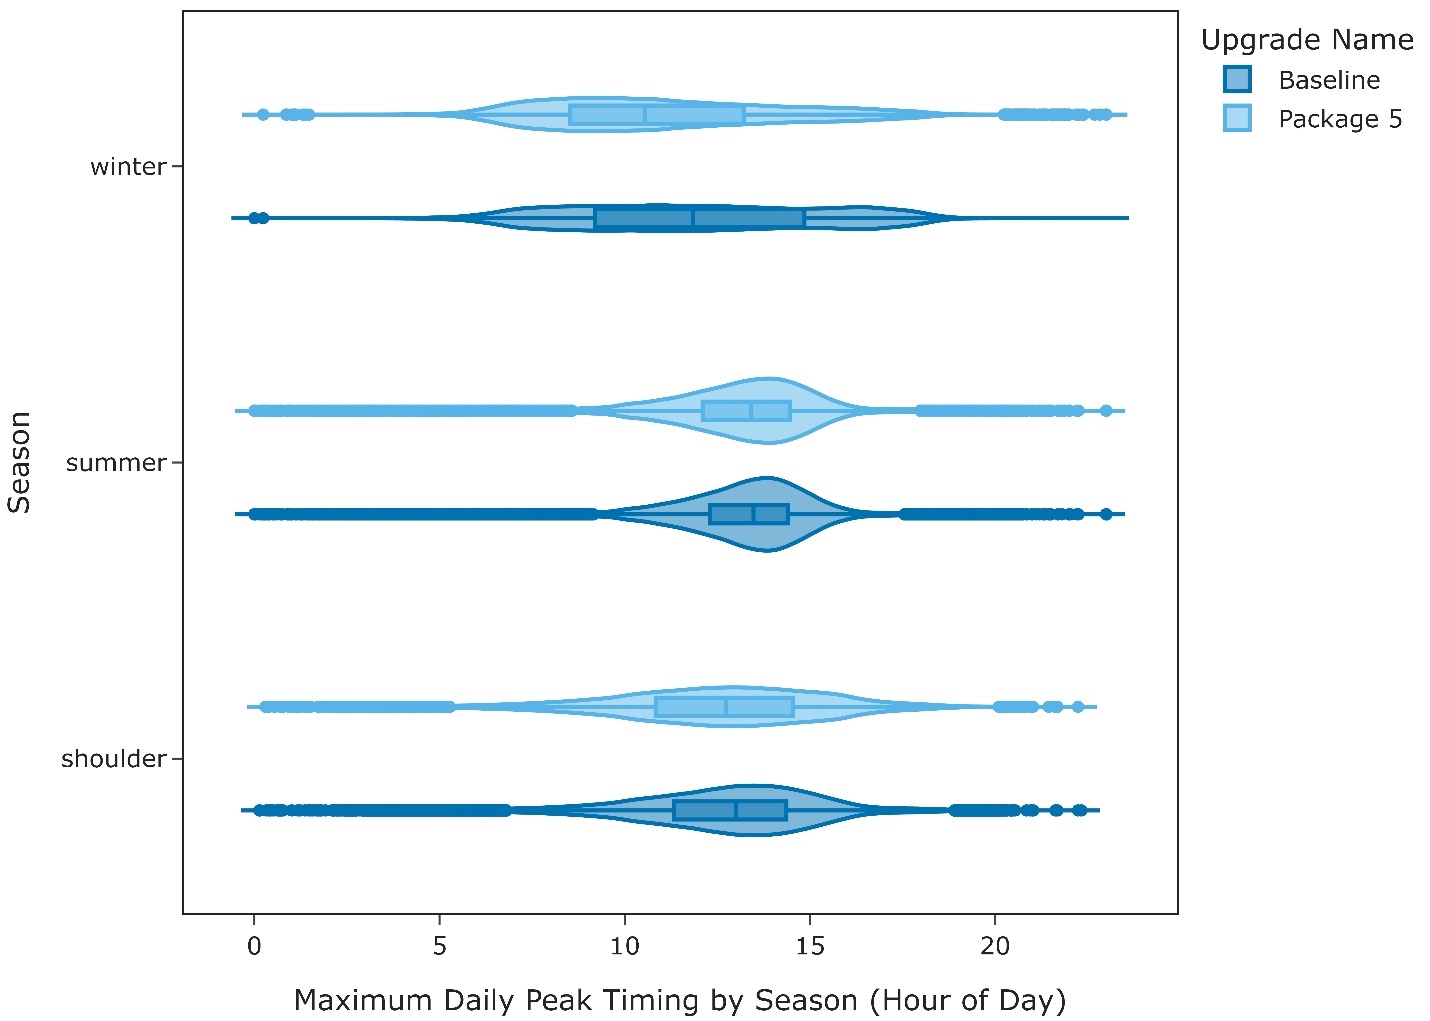
Figure 14. Maximum daily peak timing by season between the baseline and HP-RTU + ASHP Boiler + DCV + HR + Economizers (Package 5) scenario
Figure 15 shows the noncoincident peak electricity demand intensity for the median building between the ComStock baseline and the HP-RTU + ASHP Boiler + DCV + HR + Economizers scenario. Results are presented by Building America climate zone. Large peak reductions occur during the summer, with all climate zones seeing over a 17% reduction in peak electricity demand intensity. This is due to the cooling load reductions as a result of the upgrade package. Note that the Subarctic climate zone does not have any days that are considered Cooling Degree Days and therefore does not display a summer peak.
The median winter peak increased in all climate zones except for Hot-Humid, Hot-Dry, and Marine, which generally have low heating requirements. The electrification of heating caused the median winter peak intensity to increase by up to 50% in some climates, with Cold, Very Cold, and Subarctic climates showing the largest change. Note that by electrifying the heating end use, the winter peak timing can shift to a different part of the day (or different day of the year) where heating is more prevalent, so the baseline and upgrade peak intensities shown may not necessarily represent the same timestep.
The shoulder peak intensity shows reductions of 13%–19% across most climate zones, with the exception of Subarctic, which shows no change in shoulder peak intensity. This is because shoulder peaks in most climates are driven by cooling loads (which are reduced through this upgrade package), whereas shoulder peaks in the Subarctic climate are driven by heating or other miscellaneous loads.
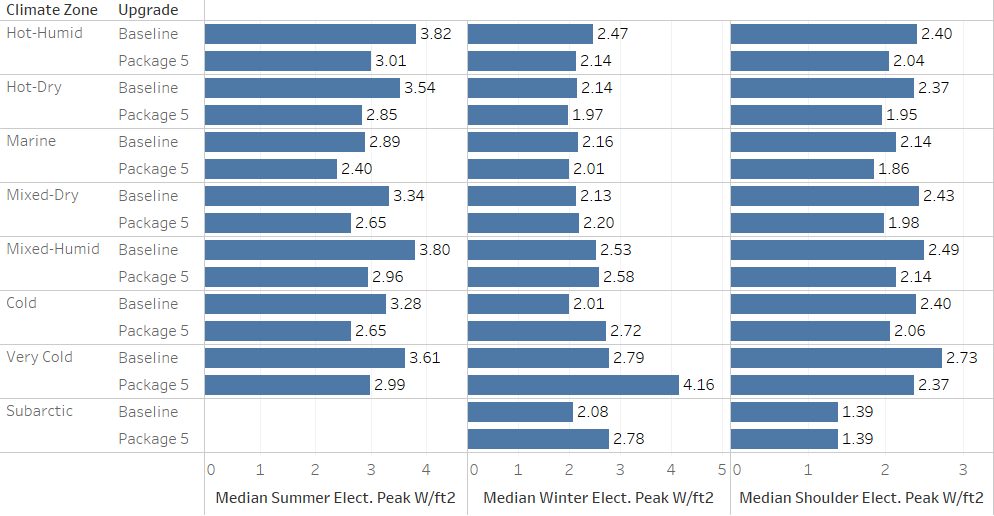
Figure 15. Maximum daily peak intensity by season and climate zone between the baseline and HP-RTU + ASHP Boiler + DCV + HR + Economizers (Package 5) scenario
6.6. Building Type Impacts
Figure 16 and Figure 17 show the impacts of the HP-RTU + ASHP Boiler + DCV + HR + Economizers upgrade package on natural gas and electricity consumption across the building types in the stock. Offices, schools, retail standalone, hospitals, and warehouses we affected most by the electrification of heating, as shown by their drastic reduction in natural gas energy. This is a result of the breakdown of existing HVAC systems in these building types. The majority have PSZ-AC systems or boilers, which were replaced by heat pumps. The building types that still show substantial gas usage generally use gas for other end uses not impacted by this measure like water heating (food service, hotels), cooking (food service, strip malls with food service) and other gas process loads, or have a high prevalence of HVAC system types not applicable to this package (e.g., PTACs in hotels).
Some building types, such as large offices, schools, hospitals, warehouses, and large hotels showed a slight increase in electricity. These typically larger building types are more likely to have received the ASHP-Boiler upgrade due to the prevalence of boiler-based HVAC systems. Because the ASHP-Boiler measure does not touch the building’s cooling system, these buildings do not benefit from the additional cooling savings from a heat pump to offset the increase electric heating load.
The remaining building types all showed a reduction in total electricity, which is a result of the HP-RTU measure improving cooling efficiency and/or the addition of DCV, Heat/Energy Recovery, and Economizers. Overall, the electricity impacts across all building types were minimal, which is a result of adding a lot of electric heating load while simultaneously improving efficiency of cooling and fan end uses.
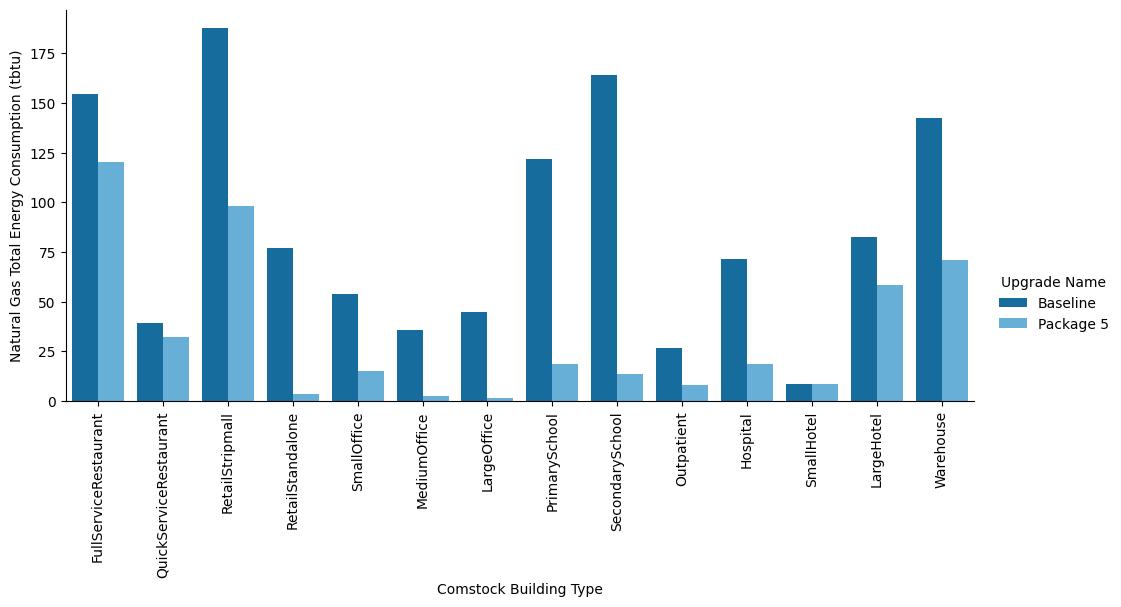
Figure 16. Annual stock natural gas energy consumption by building type before and after the HP-RTU + ASHP Boiler + DCV + HR + Economizers package (Package 5) was applied
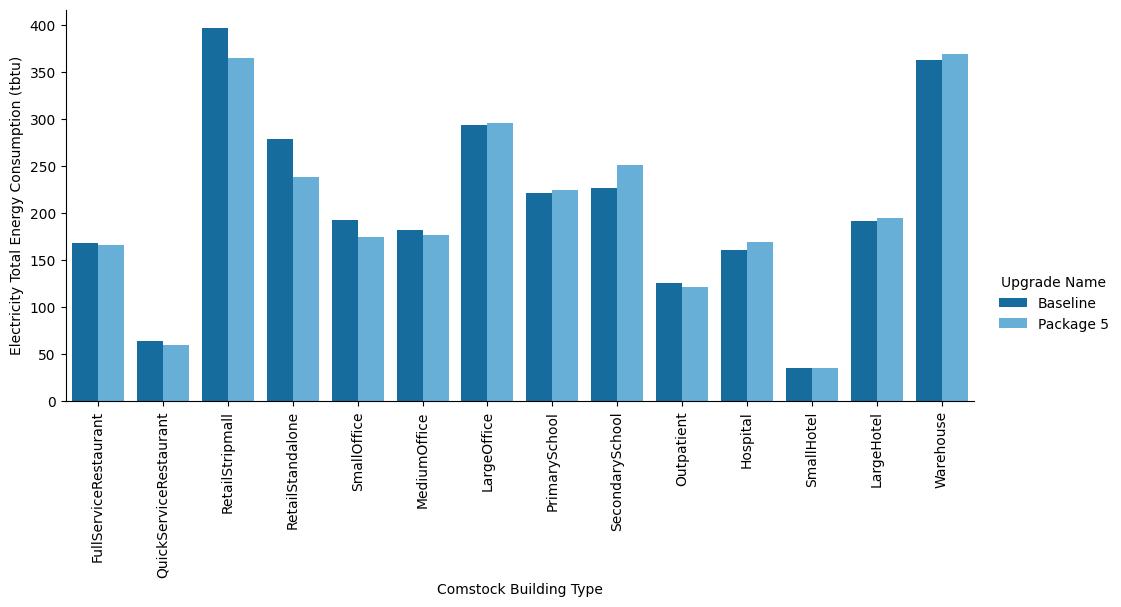
Figure 17. Annual stock electricity consumption by building type before and after the HP-RTU + ASHP Boiler + DCV + HR + Economizers package (Package 5) was applied
References
[1] "2018 COMMERICAL BUILDINGS ENERGY CONSUMPTION SURVEY (CBECS)," [Online]. Available: https://www.eia.gov/consumption/commercial. [Accessed 14 November 2022].
[2] A. Parker, H. Horsey, M. Dahlhausen, M. Praprost, C. CaraDonna, A. LeBar and L. Klun, "ComStock Reference Documentation: Version 1," National Renewable Energy Laboratory, Golden, CO, 2022.
[3] "EnergyPlus Version 22.1.0 Documentation Input Output Reference," 2022. [Online]. Available: https://energyplus.net/documentation.
[4] ASHRAE, 2015 ASHRAE Handbook HVAC Applications, 2015.
[5] Natural Resources Canada, "AIR-SOURCE HEAT PUMP SIZING AND SELECTION GUIDE," 2020. [Online]. Available: https://natural-resources.canada.ca/sites/nrcan/files/canmetenergy/pdf/ASHP%20Sizing%20and%20Selection%20Guide%20(EN).pdf.
[6] "Cambium | Energy Analysis | NREL," [Online]. Available: https://www.nrel.gov/analysis/cambium.html. [Accessed 02 September 2022].
[7] "Emissions & Generation Resource Integrated Database (eGRID) | US EPA," [Online]. Available: https://www.epa.gov/egrid. [Accessed 02 September 2022].
[8] E. Present, P. Gagnon, E. J. H. Wilson, N. Merket, P. R. White and S. Horowitz, "Choosing the Best Carbon Factor for the Job: Exploring Available Carbon Emissions Factors and the Impact of Factor Selection," in 2022 ACEEE Summer Study on Energy Efficiency in Buildings, Pacific Grove, CA, 2022.
[9] G. Vijayakumar, ANSI/RESNET/ICC 301-2022 - Standard for the Calculation and Labeling of the Energy Performance of Dwelling and Sleeping Units using an Energy Rating Index, Oceanside, CA, 2022.
[10] "Commerical Buildings Energy Consumption Survey (CBECS)," 2012. [Online]. Available: https://www.eia.gov/consumption/commercial/data/2012. [Accessed 15 November 2022].
[11] B. Thornton, M. Rosenberg, E. Richman, W. Wang, Y. Xie, J. Zhang, H. Cho, V. Mendon, R. Athalye and B. Liu, "Achieving the 30% Goal: Energy and Cost Savings Analysis of ASHRAE Standard 90.1-2010," Pacific Northwest National Laboratory, 2011.