Window Replacement + Exterior Wall Insulation + Roof Insulation
Authors: Amy LeBar and Marley Praprost
Executive Summary
Building on the successfully completed effort to calibrate and validate the U.S. Department of Energy’s ResStock™ and ComStock™ models over the past 3 years, the objective of this work is to produce national data sets that empower analysts working for federal, state, utility, city, and manufacturer stakeholders to answer a broad range of analysis questions.
The goal of this work is to develop energy efficiency, electrification, and demand flexibility end-use load shapes (electricity, gas, propane, or fuel oil) that cover a majority of the high-impact, market-ready (or nearly market-ready) upgrade measures, or upgrades. “Measures” refers to energy efficiency variables that can be applied to buildings during modeling.
An end-use savings shape is the difference in energy consumption between a baseline building and a building with an energy efficiency, electrification, or demand flexibility upgrade applied. It results in a time-series profile that is broken down by end use and fuel (electricity or on-site gas, propane, or fuel oil use) at each time step.
ComStock is a highly granular, bottom-up model that uses multiple data sources, statistical sampling methods, and advanced building energy simulations to estimate the annual subhourly energy consumption of the commercial building stock across the United States. The baseline model intends to represent the U.S. commercial building stock as it existed in 2018. The methodology and results of the baseline model are discussed in the final technical report of the End-Use Load Profiles project.
An upgrade package applies one or more End-Use Savings Shapes upgrades to a single building model simulation. Because ComStock is a bottom-up physics-based model, an upgrade package will go beyond aggregating or summing the individual upgrade results and produce novel results by simulating interactions between the upgrades. For example, pairing an envelope upgrade with an electrification upgrade would likely result in higher savings results than the sum of these upgrades individually, and the size of the heating, ventilating, and air conditioning (HVAC) equipment may be reduced if the envelope upgrade reduces the loads significantly.
This documentation focuses on an upgrade package of three end-use savings shapes upgrades—Window Replacement, Exterior Wall Insulation, and Roof Insulation, which we will refer to collectively as the “High-Efficiency Envelope” package. Depending on applicability criteria, this package will upgrade window, wall, and roof thermal properties to align with those specified in ASHRAE’s Advanced Energy Design Guide (AEDG), respective of the model’s particular climate zone. More details on the individual upgrades can be found on the ComStock Measures Documentation page.
The High-Efficiency Envelope upgrade package is applicable to 100% of the total stock floor area, meaning one or more of the measures are applicable to all buildings in the stock. The package demonstrates 7.2% total site energy savings (332 trillion British thermal units [TBtu]) for the U.S. commercial building stock modeled in ComStock (Figure 2). The savings are primarily attributed to natural gas heating and electricity cooling due to wall and roof insulation improvements and reduced heat gain through windows:
-
17.6% stock heating gas savings (146 TBtu)
-
22.5% stock heating electricity savings (44.3 TBtu)
-
11.7% stock cooling electricity savings (84.8 TBtu)
-
3.6% stock fan electricity savings (21.1 TBtu).
The High-Efficiency Envelope package demonstrates between 7.9 and 16.9 million metric tons (CO2e) of greenhouse gas emissions avoided for the three grid electricity scenarios presented, as well as 9.8 million metric tons of greenhouse gas emissions avoided for on-site natural gas consumption.
Acknowledgments
The authors would like to acknowledge the authors of the original measures in the Interior High-Efficiency Envelope package: Lauren Adams, Chris CaraDonna, Amy LeBar, and Andrew Parker. Thank you also to the reviewers of this package, Eric Ringold and Shanti Pless (National Renewable Energy Laboratory).
1. Introduction
This documentation covers the High-Efficiency Envelope upgrade package methodology and briefly discusses key results. Results can be accessed via the ComStock Published Datasets page.
| Package Title | High-Efficiency Envelope |
| Package Definition | This package upgrades windows, walls, and roofs in applicable models. It is a combination of three measures released in 2023 Release 1: Window Replacement, Exterior Wall Insulation, and Roof Insulation. |
| Applicability | This package is applicable to 100% of the stock floor area. For a package to be applicable, the model must meet the applicability criteria of one or more of the measures. Window Replacement: All windows with assembly U-values greater than those proposed in the Zero-Energy Small/Medium Office Advanced Energy Design Guide (AEDG), and all windows with solar heat gain coefficients (SHGCs) greater than those proposed in the AEDG. This measure is applicable to 99.92% of ComStock floor area. Exterior Wall Insulation: Models with mass, steel-framed, or wood-framed walls. This measure is applicable to 98.44% of ComStock floor area. Roof Insulation: Models with roof insulation R-values that are below those specified in the AEDG for the respective climate zone. This measure is applicable to 99.98% of ComStock floor area. |
| Not Applicable | Window Replacement: Windows that already exceed the properties proposed in the AEDG, for each climate zone. Exterior Wall Insulation: Models with metal walls, those whose existing wall insulation already meets or exceeds AEDG recommendations, and when the required additional exterior insulation thickness is less than 0.5 in. Roof Insulation: Models with roof insulation R-values that already meet or exceed the R-values specified in the AEDG. |
| Release | 2023 Release 2: 2023/comstock_amy2018_release_2/ |
2. Technology Summary
The building envelope refers to the physical barrier between the external environment and the conditioned spaces of a building. It includes a building’s windows, walls, roofs, doors, insulation, exterior cladding systems, and air, vapor, and moisture barriers. Envelope technologies affect the energy consumption of several different end uses in a building, such as interior lighting, ventilation, heating, and cooling. According to Better Buildings, these technologies are responsible for 30% of primary energy consumed in residential and commercial buildings [1]. Improving the performance of the building envelope can therefore have a substantial impact on whole-building energy consumption.
This upgrade package focuses on three elements of the building envelope: windows, walls, and roofs. The upgrade package applies the Window Replacement, Exterior Wall Insulation, and/or Roof Insulation measures based on the applicability criteria of each individual measure. A model will have all, some, or none of the upgrades applied, depending on how the model’s characteristics align with each measure’s applicability criteria.
For details about each of the three technologies, reference their individual measure documentation: Window Replacement, Exterior Wall Insulation, and Roof Insulation.
3. ComStock Baseline Approach
The following sections provide high-level summaries of the ComStock baseline approach for windows, walls, and roofs. For more detail about how these systems are modeled in the ComStock baseline, including data sources, refer to the ComStock Reference Documentation [2].
3.1. Windows
The ComStock baseline uses a mix of wood-framed and aluminum-framed windows with or without a thermal break. They range from single-pane to triple-pane and can be clear/tinted or low-emissivity (low-e). The properties were informed by a variety of data sources, described in the ComStock Reference Documentation and shown in Table 1 [2].
Table 1. ComStock Baseline Window Properties
| Number of Panes | Glazing Type | Frame Material | Low-E Coating | Assembly U-Factor IP (Btu/h ft2 F) | SHGC | VLT* |
|---|---|---|---|---|---|---|
| Single | Clear | Aluminum | No | 1.178 | 0.744 | 0.754 |
| Single | Tinted/Reflective | Aluminum | No | 1.178 | 0.579 | 0.455 |
| Single | Clear | Wood | No | 0.910 | 0.683 | 0.723 |
| Single | Tinted/Reflective | Wood | No | 0.910 | 0.525 | 0.436 |
| Double | Clear | Aluminum | No | 0.746 | 0.646 | 0.671 |
| Double | Tinted/Reflective | Aluminum | No | 0.749 | 0.484 | 0.411 |
| Double | Clear | Aluminum | Yes | 0.559 | 0.386 | 0.591 |
| Double | Clear | Aluminum With Thermal Break | Yes | 0.499 | 0.378 | 0.591 |
| Double | Tinted/Reflective | Aluminum | Yes | 0.557 | 0.274 | 0.359 |
| Double | Tinted/Reflective | Aluminum | Yes | 0.496 | 0.266 | 0.359 |
| Triple | Clear | Aluminum | Yes | 0.300 | 0.328 | 0.527 |
| Triple | Tinted/Reflective | Aluminum | Yes | 0.299 | 0.224 | 0.320 |
*VLT stands for visible light transmission.
3.2. Walls
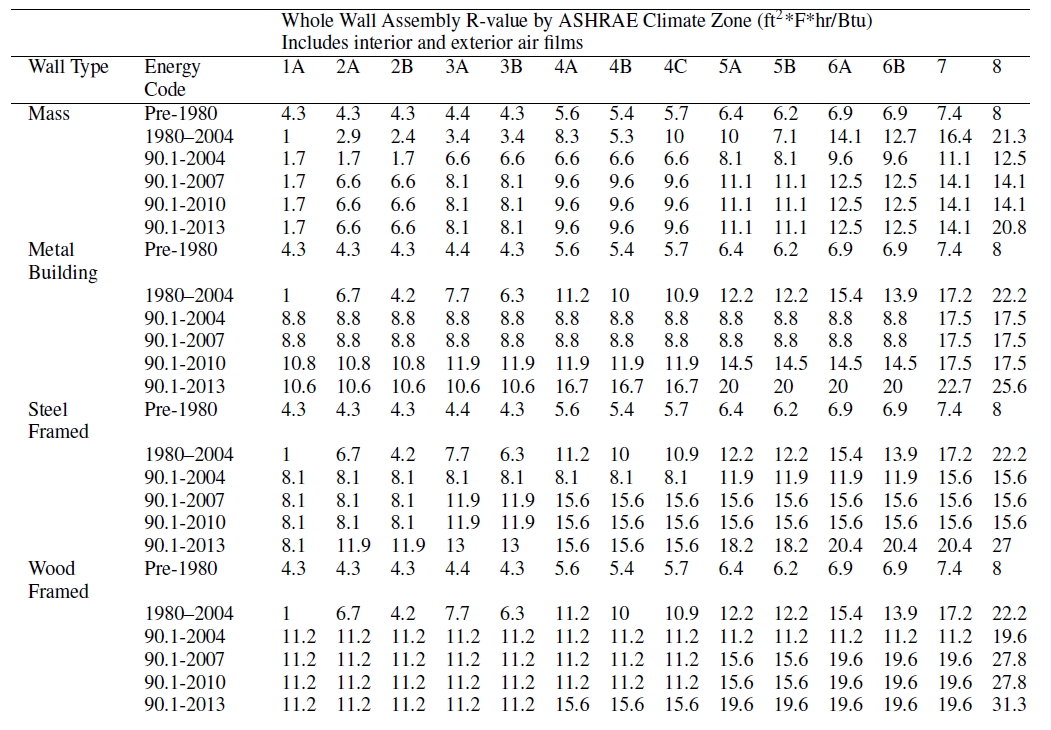
The ComStock baseline uses a mix of mass, metal building, steel-framed, and wood-framed or other walls. The properties and distribution of the wall types were informed by a variety of data sources described in the ComStock Reference Documentation [2]. R-value values by climate zone and wall type are shown in Table 2.
Table 2. Wall Assembly Thermal Performance (Outside California)
3.3. Roofs
Roofs in ComStock are modeled as flat roofs. For buildings outside of California, we chose a single roof construction type for each building type. As shown in Table 3, most buildings are assumed to use insulation entirely above deck (IEAD) roofs, which is consistent with the assumption of flat roofs. For buildings in California, we used the construction types from the California Public Utilities Commission’s Database of Energy Efficiency Resources (DEER) prototype buildings.
Table 3. Roof Construction Types
| Building Type | U.S. Department of Energy Ref and 90.1 Construction Type | U.S. Department of Energy Ref and 90.1 Building Category for Exterior Roofs | DEER (CA ONLY) Construction Type | DEER (CA ONLY) Building Category for Exterior Roofs |
|---|---|---|---|---|
| Full-Service Restaurant | IEAD | Nonresidential | Wood Framed | Nonresidential |
| Hospital | IEAD | Nonresidential | Mass | Nonresidential |
| Large Hotel | IEAD | Residential | IEAD | Residential |
| Large Office | IEAD | Nonresidential | Mass | Nonresidential |
| Medium Office | IEAD | Nonresidential | Mass | Nonresidential |
| Outpatient | IEAD | Nonresidential | Mass | Nonresidential |
| Primary School | IEAD | Nonresidential | Wood Framed | Nonresidential |
| Quick-Service Restaurant | IEAD | Nonresidential | Wood Framed | Nonresidential |
| Retail | IEAD | Nonresidential | IEAD | Nonresidential |
| Secondary School | IEAD | Nonresidential | Wood Framed | Nonresidential |
| Small Hotel | IEAD | Residential | Wood Framed | Residential |
| Small Office | IEAD | Nonresidential | Wood Framed | Nonresidential |
| Strip Mall | IEAD | Nonresidential | Wood Framed | Nonresidential |
| Warehouse | Metal* | Semiheated* | Wood Framed | Nonresidential |
*Except pre-1980, which assumes IEAD and nonresidential for all years.
4. Modeling Approach
The following sections summarize the modeling approach and applicability for the three upgrades included in this upgrade package. For more detailed descriptions, reference the individual upgrade documentations, available on the ComStock documentation website.
4.1. Window Replacement
The Window Replacement replaces the windows of a model with new windows with thermal and tinting properties that align with the properties specified in the Zero Energy Small/Medium Office AEDG (Table 4). The upgrade will first identify the existing window properties for each ComStock baseline model. In cases where the U-value (thermal transmittance) and SHGC underperform those specified in the AEDG, the windows will be replaced with AEDG-compliant windows.
Table 4. AEDG Target Properties for Window Replacements [3]
| 0 | 1 | 2 | 3 | 4 | 5 | 6 | 7 | 8 | |
| Number of Panes | Double | Double | Double | Double | Double | Double | Double | Triple | Triple |
| Fill | Air | Air | Air | Air | Argon or vacuum | Argon or vacuum | Argon or vacuum | Argon or vacuum | Argon or vacuum |
| Thermal Breaks | ~1 | ~1 | ~1 | ~1 | >1 | >1 | >1 | >1 | >1 |
| Maximum Assembly U-Factor (Btu/hr ft2 F) | 0.48 | 0.48 | 0.43 | 0.40 | 0.34 | 0.34 | 0.32 | 0.28 | 0.25 |
| Maximum SHGC | 0.21 | 0.22 | 0.24 | 0.24 | 0.34 | 0.36 | 0.36 | 0.38 | 0.38 |
4.1.1. Applicability
This upgrade is applicable to models of all building types with existing windows. Triple-pane windows are excluded from this analysis because they are already high-performing. However, triple-pane windows are a very low percentage of windows in the commercial building stock. This upgrade effectively replaces windows in over 99% of ComStock floor area.
4.2. Exterior Wall Insulation
The Exterior Wall Insulation applies extruded polystyrene (XPS) insulation to applicable building models. First, it determines the thickness of XPS required to meet the specified R-value, determined from the Zero Energy Small/Medium Office AEDG target assembly performance for each climate zone (Table 5). Second, it finds all the constructions used by exterior walls in the model, clones them, adds a layer of insulation to the cloned constructions, and then assigns the construction back to the wall. Based on the baseline, the updated wall properties may be close to the target values, but exact target values may not be achieved.
Table 5. AEDG Overall Wall Assembly Performance Characteristics by Climate Zone [3]
| ASHRAE Climate Zone | 1 | 2 | 3 | 4 | 5 | 6 | 7 | 8 |
|---|---|---|---|---|---|---|---|---|
| R-Value (hr ft2 F/Btu) | 13 | 13 | 16 | 16 | 19 | 21 | 21 | 29 |
4.2.1. Applicability
Based on the many examples readily identified through a cursory search, it appears that exterior insulation is readily applied to mass, wood-framed, and steel-framed walls. For metal buildings, interior insulation is a more practical and likely retrofit; this upgrade is therefore not applicable to metal buildings.
For modeling purposes, we calculate the thickness of XPS insulation necessary to bring the wall assembly up to the AEDG recommendation for each climate zone. When the existing walls already meet or exceed the AEDG recommendations, this upgrade is not applicable. When the required insulation thickness is less than 0.5 in., this upgrade is not applicable. For required thicknesses greater than 0.5 in., the selected thickness is rounded to the nearest inch using standard rounding to reflect commonly available products.
This upgrade is applicable to 98.4% of the ComStock floor area.
4.3. Roof Insulation
The Roof Insulation increases the insulation value of roof surfaces in the models such that the final applied insulation value meets the specified R-value, determined from the Zero Energy Small/Medium Office AEDG target assembly performance for each climate zone (Table 6), skipping roof surfaces that already meet or exceed these values. To better align with how insulation is often sold, the applied thickness of additional insulation is rounded up to the nearest inch, which may cause some buildings to slightly exceed the AEDG values. The upgrade assumes XPS insulation with a thermal resistance of R-5/inch.
Table 6. AEDG Overall Target Roof Assembly Performance Characteristics by Climate Zone [3]
| ASHRAE Climate Zone | 1 | 2 | 3 | 4 | 5 | 6 | 7 | 8 |
|---|---|---|---|---|---|---|---|---|
| R-Value (hr ft2 F/Btu) | 21 | 26 | 26 | 33 | 33 | 33 | 37 | 37 |
4.3.1. Applicability
The roof insulation upgrade is applicable to all roof surfaces with R-values below the target AEDG R-values. For ComStock, only roofs that follow the ComStock 90.1-2013 energy code during the last roof replacement (or installation) have R-values that meet or exceed the AEDG suggestions. This upgrade is applicable to over 99% of the ComStock floor area.
4.4. Greenhouse Gas Emissions
Three electricity grid scenarios are presented to compare the emissions of the ComStock baseline and the High-Efficiency Envelope scenario. The choice of grid scenario will impact the grid emissions factors used in the simulation, which determines the corresponding emissions produced per kilowatt-hour. Two scenarios—Long-Run Marginal Emissions Rate (LRMER) High Renewable Energy Cost 15-Year and LRMER Low Renewable Energy Cost 15-Year—use the Cambium data set, and the last uses the eGrid data set [4], [5]. All three scenarios vary the emissions factors geospatially to reflect the variation in grid resources used to produce electricity across the United States. The Cambium data sets also vary emissions factors seasonally and by time of day. This study does not imply a preference for any particular grid emissions scenario, but other analysis suggests that the choice of grid emissions scenario can impact results [6]. Emissions due to on-site combustion of fossil fuels use the emissions factors shown in Table 7, which are from Table 7.1.2(1) of the draft American National Standards Institute/Residential Energy Services Network/International Code Council 301 [7]. To compare total emissions due to both on-site fossil fuel consumption and grid electricity generation, the emissions from a single electricity grid scenario should be combined with all three on-site fossil fuel emissions.
Table 7. On-Site Fossil Fuel Emissions Factors
| Natural gas | 147.3 lb/MMBtu (228.0 kg/MWh)a |
| Propane | 177.8 lb/MMBtu (182.3 kg/MWh) |
| Fuel oil | 195.9 lb/MMBtu (303.2 kg/MWh) |
a lb = pound; MMBtu = million British thermal units; kg = kilogram; MWh = megawatt-hour
4.5. Limitations and Concerns
Window assembly U-value is often a function of the ratio of frame area to glass area. ComStock currently uses the simple glazing object, which accepts a constant U-value input regardless of window size and therefore does not capture U-value differences with window size. Furthermore, ComStock does not differentiate between punched windows, curtainwall, storefront, etc., which can have different performance characteristics. Neither of these limitations are expected to impact stock-level analysis in a substantial way.
In general, real buildings may have limitations beyond what has been included in the upgrades’ applicability criteria that could affect the upgrade results. Examples could include existing structural limitations, the presence of hazardous materials such as asbestos, or aesthetic/historical requirements that preclude certain upgrades.
5. Output Variables
Table 8 includes a list of output variables that are calculated in ComStock by the upgrades included in this package. These variables are important in terms of understanding the differences between buildings with and without the High-Efficiency Envelope upgrade package applied. These output variables can also be used for understanding the economics of the upgrades (e.g., return on investment) if cost information (i.e., material, labor, and maintenance costs for technology implementation) is available.
Table 8. Output Variables Calculated From the Upgrade Applications
| Upgrade | Variable Name | Description |
| Window Replacement | Window-to-Wall Ratio | Ratio of window area to exterior wall area for the building model. |
| Window Type | Name of window type, as described in Table 1. | |
| Average Window SHGC | Average SHGC of all the windows in the building model. | |
| Average Window U-Value | Average thermal conductance of all the windows in the building model (Btu/hr ft2 F). | |
| Window Area | Total window area replaced by the upgrade (ft2). | |
| Exterior Wall Insulation | Target R-value | Target insulation R-value based on climate zone (ft2-hr-R/Btu). |
| Insulation R-value per Inch | XPS R-value per inch (hr ft2 R/Btu per inch). | |
| Required Insulation Thickness | Insulation thickness required to meet target R-value (in.). | |
| Exterior Wall Insulation Area | Area of insulation added (ft2). | |
| Roof Insulation | Energy Code Followed During Last Roof Replacement | The energy code followed during the last roof replacement (or installation) for a building model, which dictates the roof performance properties for the ComStock baseline models. |
| Average Roof Absorptance | The average absorptance of all roof surfaces for a building model. | |
| Average Roof U-Value | The average thermal conductivity of all roof surfaces for a building model (Btu/hr ft2 F). | |
| Roof Area | The exterior roof area for a building model (ft2). |
6. Results
In this section, results are presented both at the stock level and for individual buildings through savings distributions. Stock-level results include the combined impact of all the analyzed buildings in ComStock, including buildings that are not applicable to this upgrade. Therefore, they do not necessarily represent the energy savings of a particular or average building. Stock-level results should not be interpreted as the savings that a building might realize by implementing the High-Efficiency Envelope package.
Total site energy savings are also presented in this section. Total site energy savings can be a useful metric, especially for quality assurance/quality control, but this metric on its own can have limitations for drawing conclusions. Further context should be considered, as site energy savings alone do not necessarily translate proportionally to savings for a particular fuel type (e.g., gas or electricity), source energy savings, cost savings, or greenhouse gas savings. This is especially important when an upgrade impacts multiple fuel types or causes decreased consumption of one fuel type and increased consumption of another. Many factors should be considered when analyzing the impact of an energy efficiency or electrification strategy, depending on the use case.
6.1. Single Building Example
A 37,500-ft2 quick service restaurant in Los Angeles with pre-1980 components was selected as a test example. All three measures within the package are applicable to this model. Table 9 shows the initial and final conditions for the three measures. The thermal properties of the model’s windows, walls, and roof were all increased, indicating the package was applied correctly.
Table 9. Initial and Final Conditions for Measures Included in the High-Efficiency Envelope Package 
6.2. Realized Applicability
Figure 1 provides a breakdown of the applicability of the High-Efficiency Envelope package by individual measure. The individual component measures were applicable to nearly all stock floor area, and the package was applicable to all stock floor area.
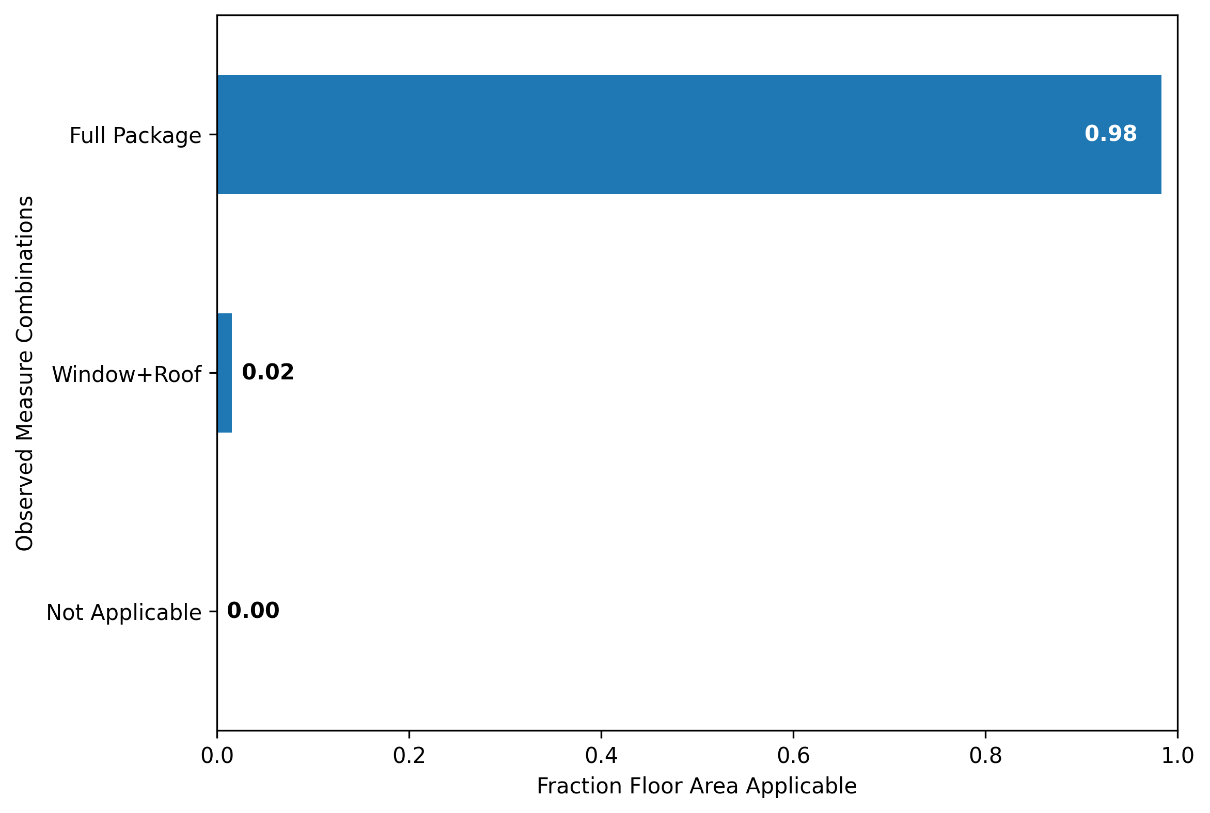
Figure 1. Applicability for the High-Efficiency Envelope package and by individual measure
6.3. Stock Energy Impacts
The High-Efficiency Envelope upgrade package demonstrates 7.2% total site energy savings (332 trillion TBtu) for the U.S. commercial building stock modeled in ComStock (Figure 2). The savings are primarily attributed to natural gas heating and electricity cooling due to wall and roof insulation improvements and reduced heat gain through windows:
-
17.6% stock heating gas savings (146 TBtu)
-
22.5% stock heating electricity savings (44.3 TBtu)
-
11.7% stock cooling electricity savings (84.8 TBtu)
-
3.6% stock fan electricity savings (21.1 TBtu).
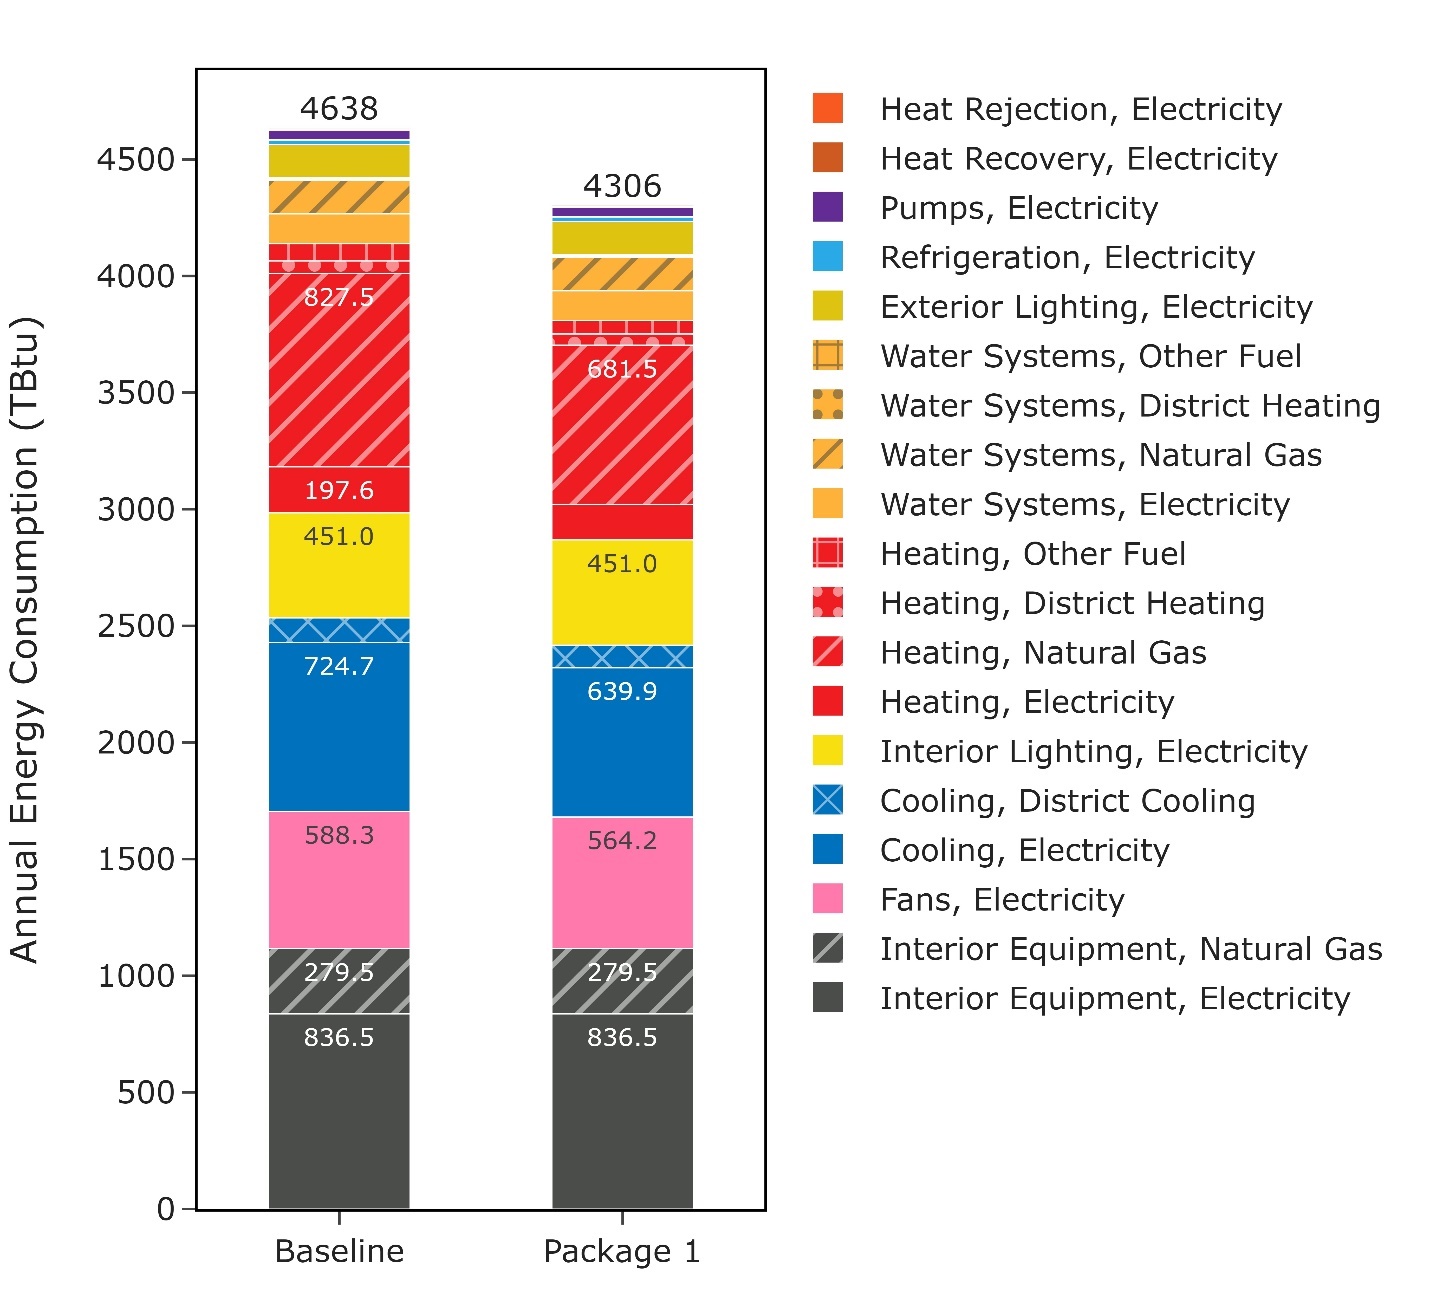
Figure 2. Comparison of annual site energy consumption between the ComStock baseline and the High-Efficiency Envelope scenario (Package 1).
Energy consumption is categorized both by fuel type and end use.
6.4. Stock Greenhouse Gas Emissions Impact
ComStock simulation results show greenhouse gas emissions avoided across all electricity grid scenarios and on-site combustion fuel types (Figure 3). For the combined impact across all sources, a single electricity grid scenario should be chosen and combined with all three on-site combustion fuel scenarios. Greenhouse gas emissions avoided from the electricity grid are between 4.9% and 5.0% for the scenarios. This is due to reduced electricity consumption from the fans and cooling end use. The 11.7%, 20.8%, and 20.0% emissions avoided from on-site combustion of natural gas, fuel oil, and propane, respectively, are attributable to wall and roof insulation improvements.
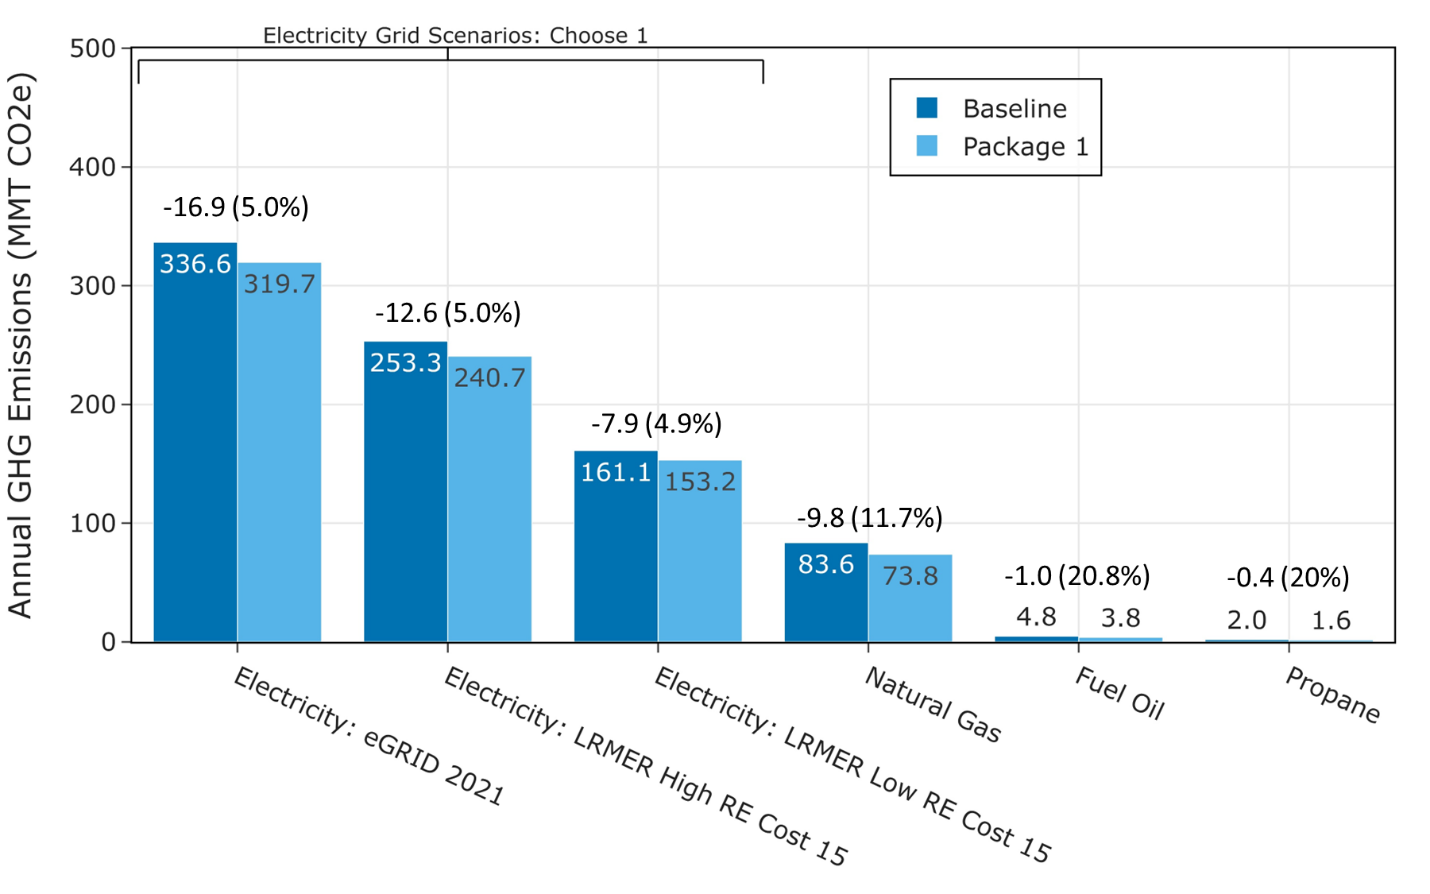
Figure 3. Greenhouse gas emissions comparison of the ComStock baseline and the High-Efficiency Envelope scenario
Three electricity grid scenarios are presented: Cambium LRMER High Renewable Energy Cost 15-Year, Cambium LRMER Low Renewable Energy Cost 15-Year, and eGrid. MMT stands for million metric tons.
6.5. Site Energy Savings Distributions
This section discusses site energy consumption for quality assurance/quality control purposes. Note that site energy savings can be useful for these purposes, but other factors should be considered when drawing conclusions, as these do not necessarily translate proportionally to source energy savings, greenhouse gas emissions avoided, or energy cost.
Figure 4 shows the percent savings distributions of the baseline ComStock models versus the High-Efficiency Envelope scenario by end use and fuel type for applicable models. Models are included in these distributions only if they experienced savings (or a penalty) for the specific distribution. Many end uses demonstrate a wide range of savings. In general, the energy efficiency measures in this package are expected to save heating and cooling energy. This is confirmed in the figure, with the median savings around 30% for natural gas heating, 45% for electric heating, and 15% for electric cooling. Heating savings are expected to be larger than cooling savings because of the larger temperature difference between inside and outside during heating season. The secondary effects are expected to be decreased fan and pump electricity used to move the air and water for heating and cooling. Both electricity for fans and pumps shows around a 5% to 10% median savings. The slight changes in energy consumption for heat recovery and heat rejection are minor third-order effects associated with the runtimes of the heating and cooling equipment.
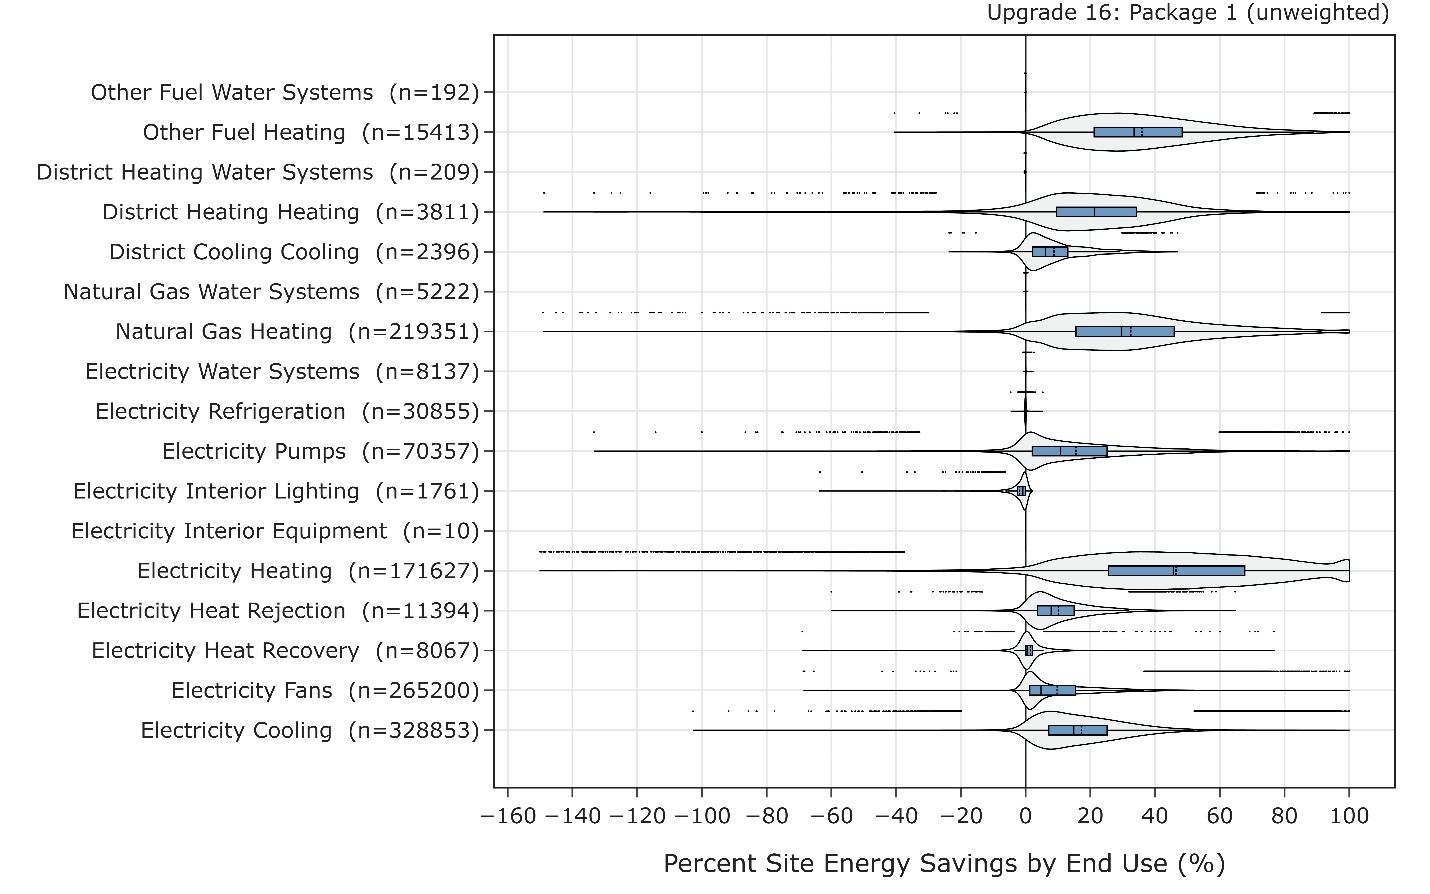
Figure 4. Percent site energy savings distribution for ComStock models with the High-Efficiency Envelope upgrade package applied by end use and fuel type.
The data points that appear above some of the distributions indicate outliers in the distribution, meaning they fall outside 1.5 times the interquartile range. The value for n indicates the number of ComStock models that were applicable for energy savings for the fuel type category.
Some end uses show negative energy savings for a small portion of the savings distributions: other fuel; district heating; natural gas and electricity heating; and electricity cooling, pumps, and fans. Heating penalties are often found in buildings with mixed-fuel HVAC systems where large increases in insulation can change the heating profile of the building and cause one fuel to incur increased energy consumption while another fuel realizes savings. For this reason, a heating penalty in the savings distribution for a single fuel type does not mean the building experienced a net heating penalty when considering the impact on all heating fuels. Additionally, decreasing the SHGC via window replacement can block some beneficial solar heat gain and therefore increase heating load for a building. Whether annual heating savings are realized depends on a combination of factors, including the window to wall area, window orientation, thermostat set points, HVAC system, outdoor air temperatures, and amount of solar radiation affecting the window surface. Heating-only HVAC system types can be especially prone to energy penalties from lower SHGC because there is no cooling system to save energy from the decreased solar gains, although this does not reflect other potential such as thermal comfort or glare control.
Many models saw cooling savings. With reduced cooling loads due to increased insulation, a building's HVAC system will have to work less frequently to maintain indoor comfort. In climate zones where economizers are required, this can lead to longer periods where economizer mode can be active. When outdoor conditions are suitable for cooling, economizer mode will be more effective because the system can use more outdoor air to cool the building without resorting to mechanical cooling.
Some models experience increased cooling energy consumption, which is often due to increased insulation holding internally generated heat within the building during cooling season, which can cause an increased cooling load. In some cases, this can cause a net site energy penalty for the building, which is most common when the building’s cooling requirements are much higher than the heating requirements. This effect is mitigated with the climate zone-specific insulation targets.
Fans and pumps follow the operation of the HVAC system, and models with heating or cooling penalties can also incur fan and pump penalties.
Figure 4 also shows especially high heating savings in some models. This generally occurs in building models with very low heating loads and energy consumption to begin with, where the increase in roof insulation removes most, or all, of whatever heating load there was. This can cause very high values in the percentage savings calculations.
Finally, some models saw an interior lighting electricity penalty. This is attributed to the lower VLT from the window measure impacting models with daylight controls. These models may not be able to turn down the interior lights as much or as often with lower VLT windows, which can increase lighting equivalent full load hours and therefore increase lighting energy consumption. Figure 5 shows the relationship between interior lighting electricity percent savings and daylight control fraction. Models with higher daylight control fraction generally see a higher interior lighting penalty. Furthermore, the design interior lighting power density does not change between the baseline and upgrade package scenarios, indicating the package is not impacting the interior lighting design. Equivalent full load hour output variables also show a 1:1 relationship between equivalent full load hour percent increase and interior lighting penalty, supporting the conclusion that lower VLT windows are causing the interior lighting energy consumption increase.
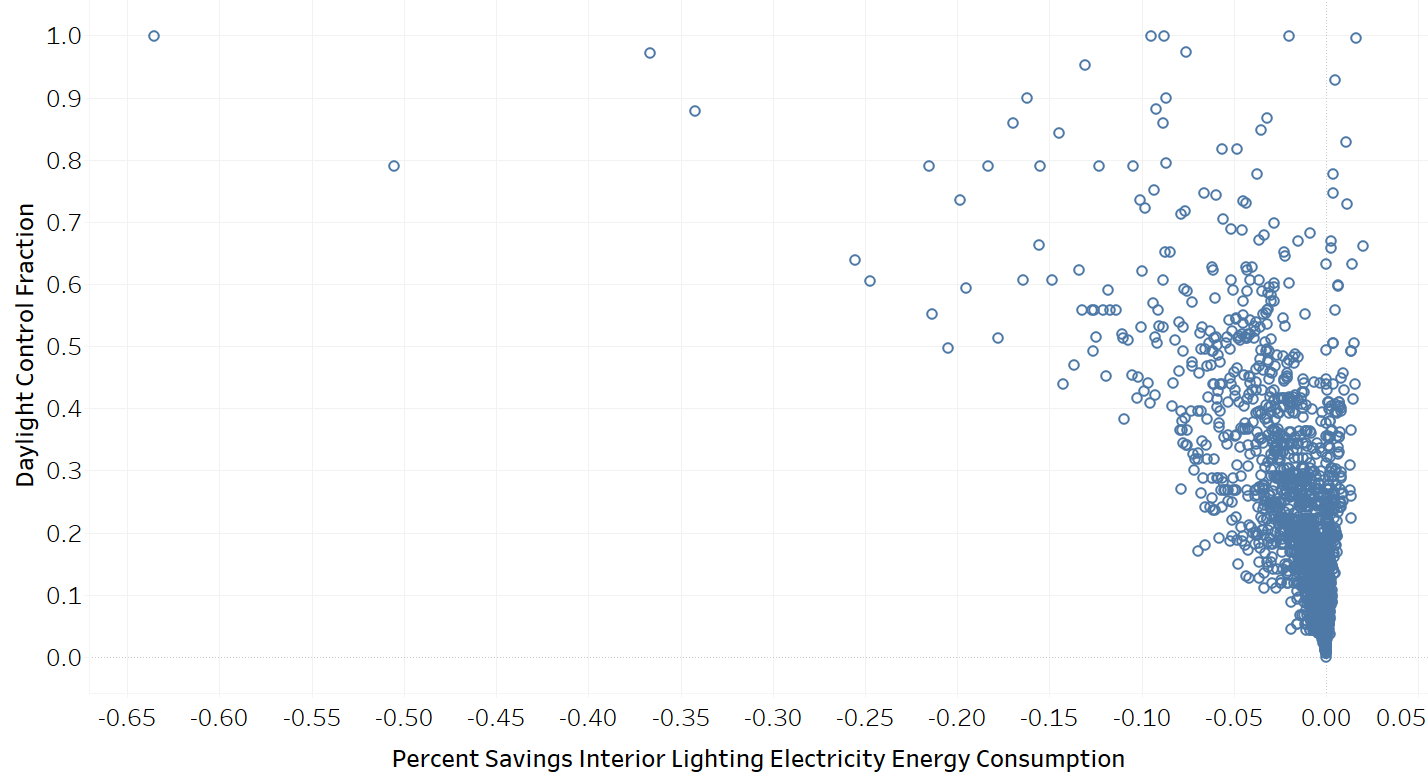
Figure 5. Daylight control fraction vs. percent savings for interior lighting electricity
6.6. Climate Zone Impacts
A building’s climate zone can affect the savings from this package (Figure 6). In general, buildings in colder climates had higher site energy savings, as expected. Warmer climates had lower median savings and the majority of the models with negative savings from this package. This is likely due to the increased wall and roof insulation holding internally generated heat within the building during cooling season (most of the year in these climate zones), which can cause an increased cooling load.
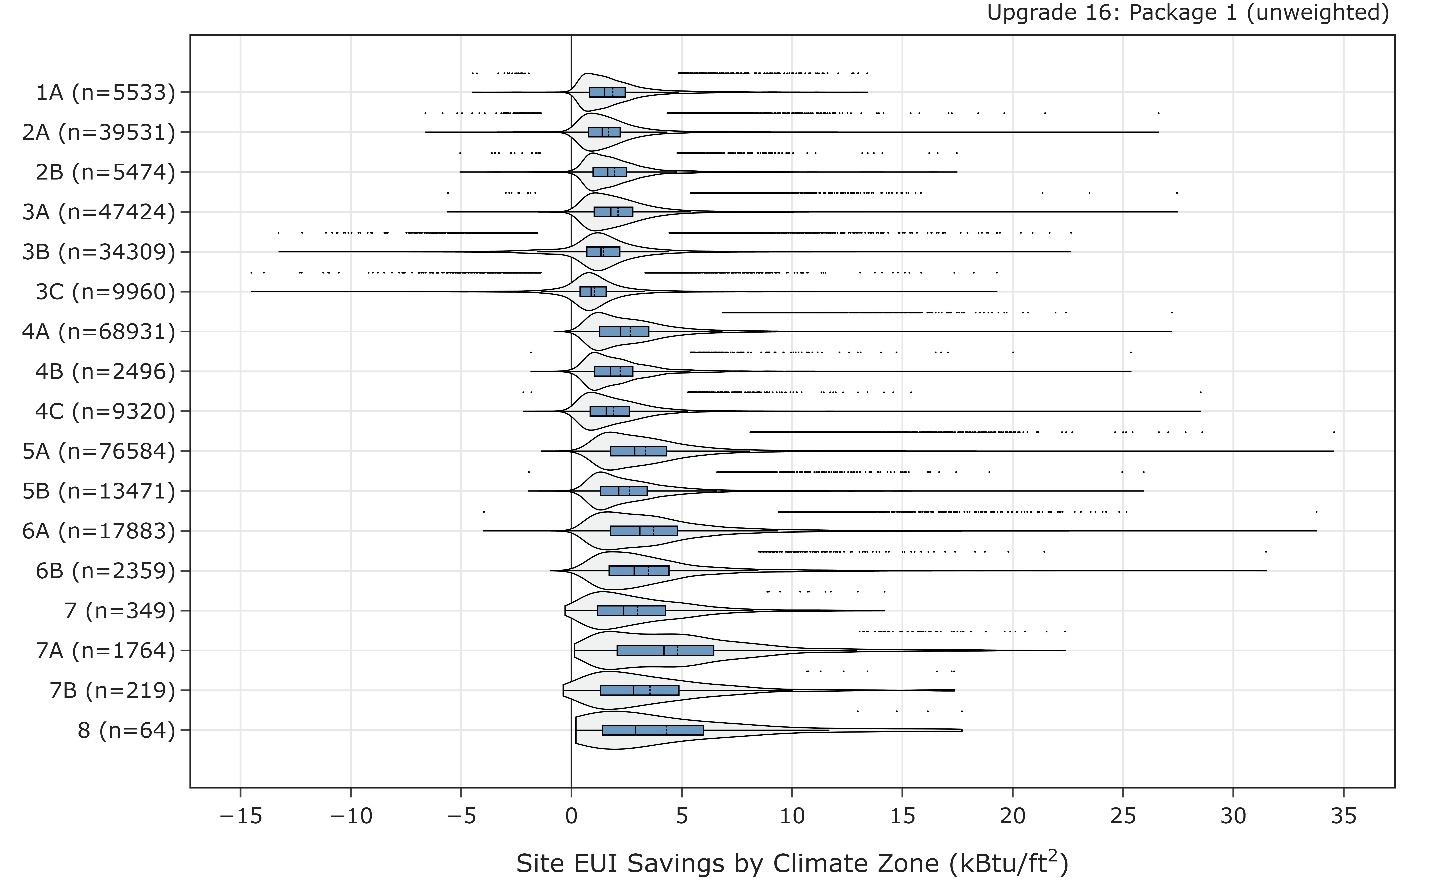
Figure 6. Site energy use intensity savings distribution for ComStock models with the High-Efficiency Envelope package applied by climate zone.
The data points that appear above some of the distributions indicate outliers in the distribution, meaning they fall outside 1.5 times the interquartile range. The value for n indicates the number of ComStock models that were applicable for energy savings for the climate zone.
6.7. Peak Impacts
Figure 7 shows the impact of the High-Efficiency Envelope package on seasonal peak hours. There are minimal visible changes in peak magnitude between the two cases.
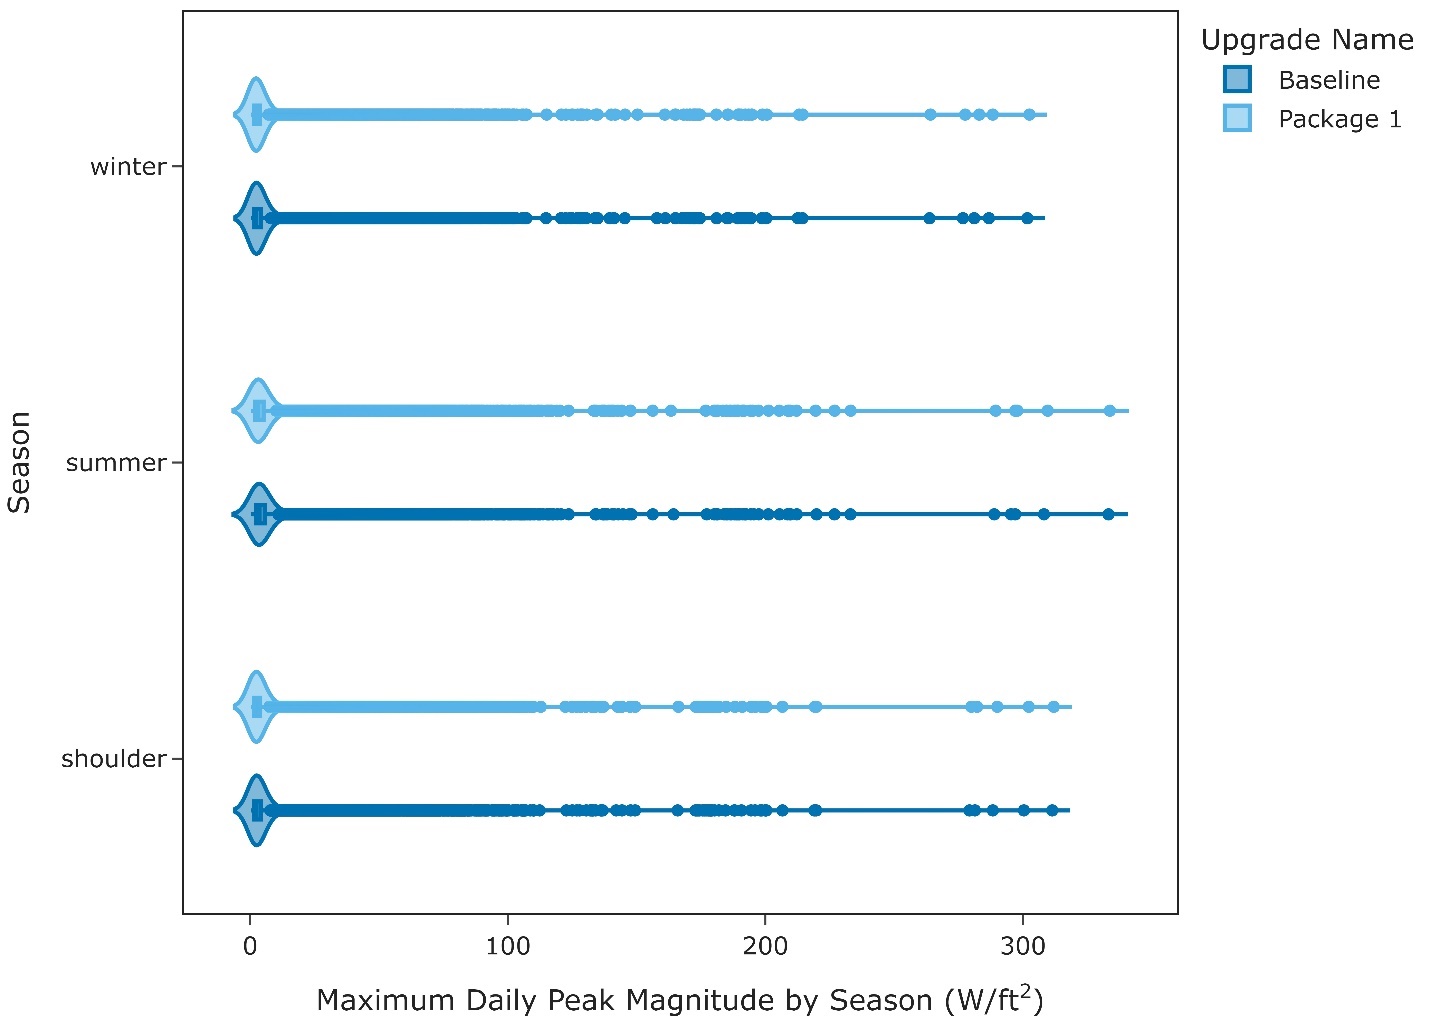
Figure 7. Maximum daily peak timing by season between the baseline and High-Efficiency Envelope scenario
References
[1] U.S. Department of Energy, "Building Envelope | Better Buildings Initiative," [Online]. Available: https://betterbuildingssolutioncenter.energy.gov/alliance/technology-solution/building-envelope. [Accessed 5 April 2023].
[2] A. Parker, H. Horsey, M. Dahlhausen, M. Praprost, C. CaraDonna, A. LeBar and L. Klun, "ComStock Reference Documentation: Version 1," National Renewable Energy Laboratory, Golden, CO, 2022.
[3] ASHRAE, "Achieving Zero Energy - Advanced Energy Design Guide for Small to Medium Office Buildings," 2019.
[4] "Cambium | Energy Analysis | NREL," [Online]. Available: https://www.nrel.gov/analysis/cambium.html. [Accessed 02 September 2022].
[5] "Emissions & Generation Resource Integrated Database (eGRID) | US EPA," [Online]. Available: https://www.epa.gov/egrid. [Accessed 02 September 2022].
[6] E. Present, P. Gagnon, E. J. H. Wilson, N. Merket, P. R. White and S. Horowitz, "Choosing the Best Carbon Factor for the Job: Exploring Available Carbon Emissions Factors and the Impact of Factor Selection," in 2022 ACEEE Summer Study on Energy Efficiency in Buildings, Pacific Grove, CA, 2022.
[7] G. Vijayakumar, ANSI/RESNET/ICC 301-2022 - Standard for the Calculation and Labeling of the Energy Performance of Dwelling and Sleeping Units using an Energy Rating Index, Oceanside, CA, 2022.
Appendix A.
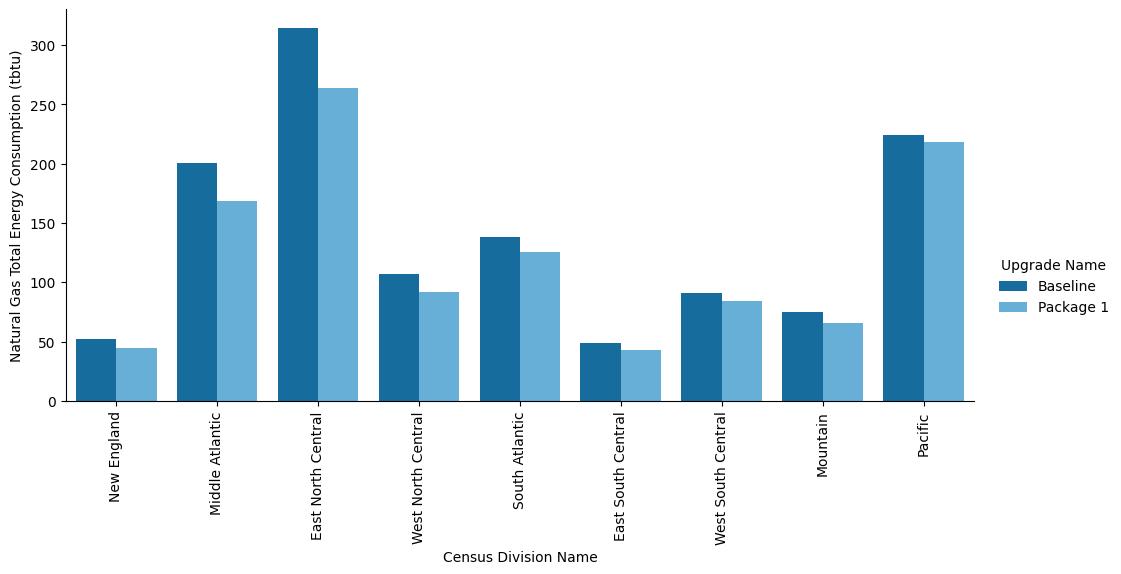
Figure A-1. Site annual natural gas consumption of the ComStock baseline and the measure scenario by census division
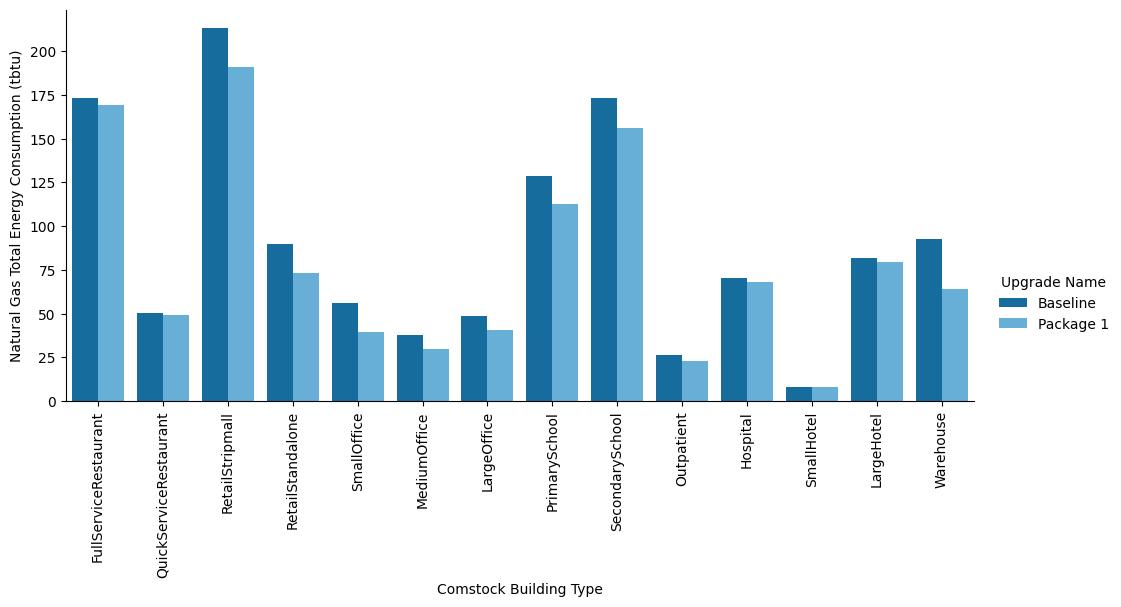
Figure A-2. Site annual natural gas consumption of the ComStock baseline and the measure scenario by building type
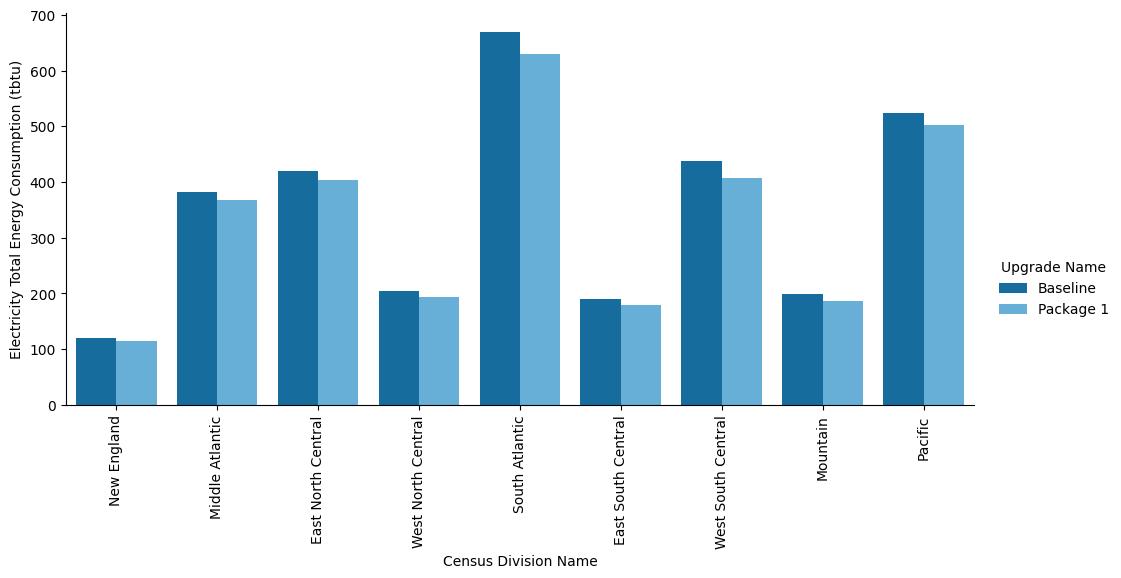
Figure A-3. Site annual electricity consumption of the ComStock baseline and the measure scenario by census division
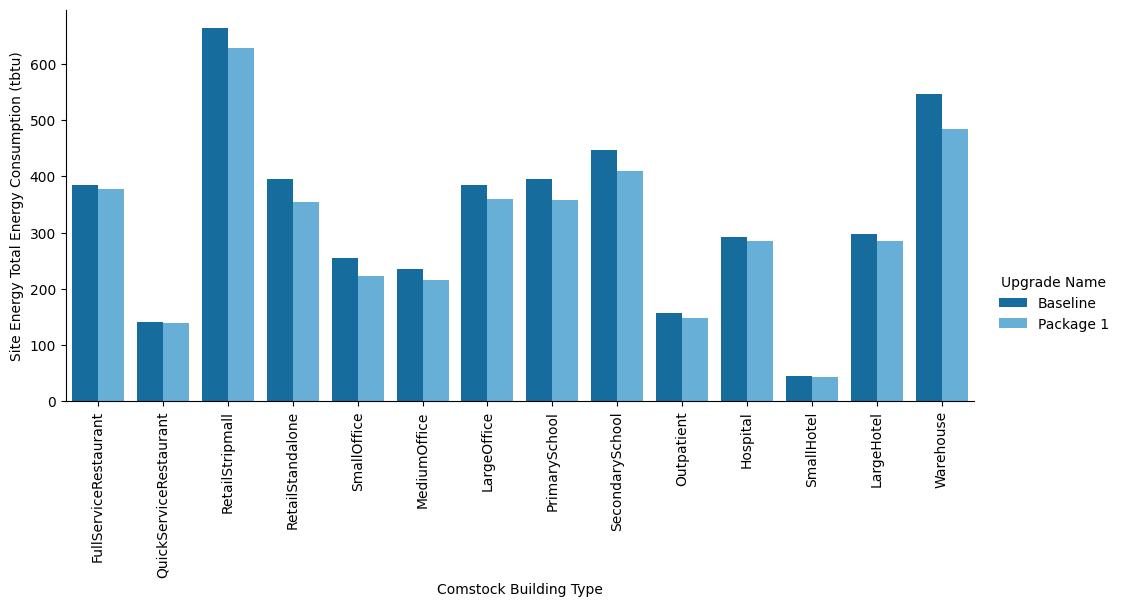
Figure A-4. Site annual electricity consumption of the ComStock baseline and the measure scenario by building type