How-to: Understand the annual energy use by building type for a city.
This how-to guide uses the ComStock 2023 Release 1 dataset. Some dataset attributes, like column names, may have changed in later releases. Most notably, the ComStock sampling method was updated to improve geographic resolution beginning with 2024 Release 2.
This guide will walk you through how to prepare city-level ComStock data for analysis using the following example statement:
I want to understand the annual energy use by building type for the city of Richmond, CA.
ComStock has multiple fields that indicate where models are located across the country. When conducting analysis for a city using the publicly available ComStock dataset, Public Use Microdata Area (PUMA)-level data is the appropriate geographic area to use for filtering the data to a city. PUMAs are non-overlapping, statistical geographic areas that partition each state or equivalent entity into geographic areas containing no fewer than 100,000 people each used by the Census Bureau and State Data Centers (SDCs). This document will walk through the steps required to download and prepare ComStock data using Microsoft Excel for conducting analysis using the city of Richmond, CA as an example. By the end of these steps, the data can be put directly into the “Basic Building Stock Characterization” workbook template to auto-generate figures, or any other data analysis tool.
There are five steps required to download PUMA-level data from ComStock and prepare it for analysis. First, identify which PUMAs represent the area of interest – in this case, Richmond, CA. Second, we identify gaps in the ComStock models for the given PUMA. Third, we choose a strategy for filling in the gaps. Fourth, we apply the strategy and calculate updated weights for the ComStock model results. Finally, we apply the new weights to prepare the results for analysis.
Note: Text in bold refers to a column in an excel sheet. In the case of the local data source the names of the individual columns will depend on the data source, and so we use descriptive column names. Text in italics describes a sheet in the excel workbook. Text in “quotes” specifies values expected in a cell or cells. Underlined text specifies an excel function.
Step 1: Identify which PUMAs represent the geography of interest.
-
Download the map file for the Census Region covering the area from the ComStock OEDI data lake geographic information folder.
-
Select the file that best matches your geography. Please refer to this Census map to determine which you should download. For this example, we will select “map_of_pumas_in_census_region_4_west.geojson” to get PUMAs in California.
-
Avoid downloading the map of the whole U.S. as the file is too large to be opened by most GeoJSON viewers.
-
-
Open the file in a GeoJSON viewer such as https://geojson.io.
-
Wait for the file to load.
-
Use the search bar to find your location; in this case, enter “Richmond, CA” in the search bar.
-
Click on the PUMA(s) that best encompass the area of interest to load the information for that PUMA.
-
Note the GISJOIN field – this is what you will use to filter the ComStock results.
-
Example for Richmond, CA:
GISJOIN: G06001301
Name: Contra Costa County (Far Southwest)--Richmond (Southwest) & San Pablo Cities PUMA
Figure 1. Example of searching Census Region 4’s geojson file for ‘Richmond, California’. Note the GISJOIN field, which is used in Step 2.
-
-
Step 2: Identify gaps in the PUMA-level ComStock models.
The ComStock dataset includes architypical models that represent collections of real buildings and is sampled at the national level. At a finer geographic resolution, for example at a PUMA-level, there are going to be segments of the building stock that are underrepresented by the Comstock dataset. It is critical to identify and fill these gaps to perform meaningful analysis. To do this follow the instructions below:
-
Download the ComStock metadata CSV file from OEDI.
-
Using Microsoft Excel, open the file and save it as an .xlsx file.
-
Using the in.nhgis_puma_gisjoin column, down select the data to the PUMA(s) of the area you are interested in. Use the GISJOIN values found in Step 1 – in the case of the Richmond, CA this would be “G06001301”
-
In the same file, create a second sheet and copy the down-selected data to it. Rename it Richmond, CA.
-
From the Richmond, CA sheet, create a PivotTable.
-
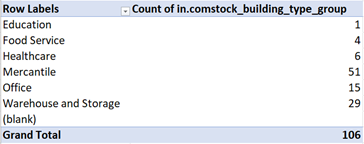
Drag the field in.comstock_building_type_group into the “Rows” and “Values” sections in the PivotTable Fields sidebar on the right. This will show how many samples of each building type group are in your area of interest.
-
For Richmond, CA, the count for each ComStock building type group is as follows:
-
First, note which groups have less than 5 samples. These have the potential to lead to inaccurate results when they are scaled. In Richmond, “Education” and “Food Service” groups have low sample counts and should be investigated further.
-
Add weight to the “Values” section in the right sidebar. This will show the approximate total building count for each building type group.

-
Take note of the Sum of weight value for the building type groups with less than 5 samples (“Education” and “Food Service”).
-
Using Google Maps or other available data source, estimate the number of actual buildings of these building type groups in the area of interest and compare against the Sum of weight values. There are about 15 Education buildings, and at least 20 Food Service buildings in Richmond (Figure 2, Figure 3). This indicates ComStock is underestimating the number of Education buildings, and for the most part accurately representing the Food Service Buildings. Takeaway: Education buildings are a gap.

Figure 2. Education buildings in Richmond, CA
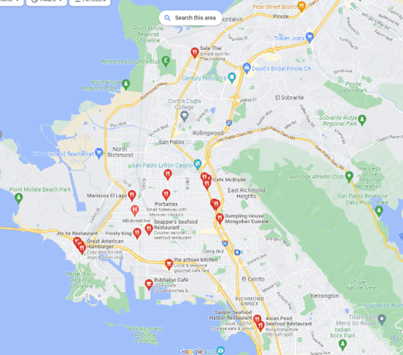
Figure 3. Food service buildings in Richmond, CA
-
-
Second, compare the list of ComStock building type groups against the complete list (Table 1). The “Lodging” group is missing from the Richmond PUMA. This group should also be investigated further.
Table 1. List of ComStock building type groups
ComStock Building Type Groups Education Food Service Healthcare Lodging Mercantile Office Warehouse and Storage -
Verify whether this is realistic or a byproduct of national-level sampling. Using Google Maps or other available data source, look up each missing building type group in the area of interest. The lodging facilities in Richmond, CA are shown the screenshot in Figure 4. There are certainly hotels and motels in this area.
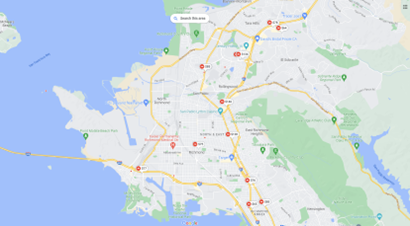
Figure 4. Lodging buildings in Richmond, CA
-
-
Step 3: Choose a strategy to fill in the gaps.
The simplest way to fill in the gaps identified in Step 2 is to add building models from a neighboring geography. For this, use your knowledge of the surrounding area and other data sources, such as Google Maps, to identify which neighboring geographies have similar building stock to the PUMA(s) of interest. The following steps outline the process that was used for Richmond.
-
We first examine models in neighboring PUMAs that have similar building stock. Of the PUMAs adjacent to “G06001301,” only “G06000101” has Lodging models in it, and there is only 1. This will not be sufficient to perform any analysis with, so we will try a different approach.
-
We next consider the county that Richmond is in – Contra Costa County. A Google Maps search indicates that the building stock in Richmond is similar to the building stock across the county. Additionally, Contra Costa County includes 853 ComStock models, of which 9 are Lodging, and 30 are Education – this is a substantial improvement, and we will use this to move forward in conducting the analysis.
Step 4: Apply the strategy and calculate updated weights for the ComStock model results.
Once you have identified the appropriate strategy to fill in the gaps, you will apply the strategy and update the ComStock weights. This step is critically important because it will affect the scaling of the energy results. The following instructions will go over the steps for the county strategy that was determined as the best fit for Richmond. However, you would follow similar steps if you were to use a different strategy, such as adding data from a neighboring PUMA.
Note that if you have access to an additional data source that specifies the square footage of various building types within the geography (e.g., an Accessors Database or information from the local school district’s website), alternative weighting options are available that may be significantly more accurate. Please use judgment and refer to the ComStock How-To Guide on Using Local Data Sources.
For the county strategy, we will scale the weights in the ComStock results by the ratio of Richmond PUMA total building floor area to Contra Costa County total building floor area. This will ensure the total building floor area matches the Richmond building floor area.
-
Create a new PivotTable from the data in the Richmond, CA sheet.
- Drag the field in.comstock_building_type_group into the “Rows” and in.weighted.floor_area..f2 into the “Values” sections in the PivotTable Fields sidebar on the right. The value listed as “Grand Total” at the bottom of the PivotTable indicates the total commercial building floor area modeled by ComStock in that PUMA.
-
Down select the national metadata by county to include Contra Costa County – “G0600130” – and copy it to a separate sheet. Rename the new sheet Contra Costa County.
-
Create a PivotTable of the county down-selected data. Rename the new sheet Contra Costa Pivot.
- Drag the field in.comstock_building_type_group into the “Rows” and in.weighted.floor_area..f2 into the “Values” sections in the PivotTable Fields sidebar on the right. The value listed as “Grand Total” at the bottom of the PivotTable indicates the total commercial building floor area modeled by ComStock in Contra Costa County.
-
Create a new sheet and copy the county down-selected data to it. Rename the sheet Richmond Adjusted.
-
Create a new column in the Richmond Adjusted sheet on the far right of the data and title it new_weight.
-
Identify the column letter of the out.weight column. In this example, it is column NY.
-
In the row 2 of the new_weight column, use the following formula to calculate the new weight.
=NY2 \* GETPIVOTDATA(\"in.weighted.floor_area..ft2\",\'Richmond Pivot\'!\$A\$3) / GETPIVOTDATA(\"in.weighted.floor_area..ft2\",\'Contra Costa Pivot\'!\$A\$3)
* Replace NY2 with the appropriate column in your data file. -
Drag and fill the rest of the new_weight column with this formula.
Step 5: Apply new weights to conduct analysis.
This step uses the new_weight column calculated in Step 4 to generate columns to use for analysis. In this example, we will generate the columns that are used in the “Basic Building Stock Characterization” workbook template .
-
Multiply the new_weight column by the unweighted column of interest.
-
For example, to create a new column capturing the interior equipment energy consumption, first create a new column in the Richmond Adjusted sheet. In row 2 of the new column, multiply new_weight by Interior Equipment..kWh and fill the remaining cells in the column.