Tutorial
This page describes how to use the JADE package to create, modify, and run jobs locally or on an HPC.
CLI Commands
All CLI commands documented in this page have a hierarchical nature. There are
group commands followed by subcommands. You can enter --help at any level.
For example:
$ jade --help
$ jade config --help
$ jade config hpc --help
HPC Configuration
This section only applies if you run your jobs on an HPC.
Change to a directory on the shared filesystem (such as /scratch on Eagle). JADE uses the filesystem for internal synchronization.
HPC Parameters
You must define your HPC configuration in a settings file. Run this command customized to your parameters.
$ jade config hpc -a my-project -p short -t slurm -w "4:00:00" -c hpc.toml
Created HPC config file hpc_config.toml
All parameters have defaults, and so you can run jade config hpc and then
edit the file afterwards.
The following parameters are optional when running on NREL’s HPC (Eagle):
partition: If not specified then the HPC will decide the partition based on the wall time value (recommended unless you are using thedebugpartition).mem: If specified then the HPC will only provide nodes that have at least this amount of memory. Refer to the HPC documentation for supported formats. On Eagle: “80GB”, “150GB”.tmp: If specified then the HPC will only provide nodes that have at least this amount of storage space as scratch space. Refer to the HPC documentation for supported formats. On Eagle: “500GB”, “2TB”.
JADE was primarily designed to maximize use of compute node CPUs when running
jobs that only require a single node. Given that objective, the default value
of nodes is 1.
JADE also supports setting nodes, ntasks, and ntasks_per_node to
allow users to run multi-node jobs. Refer to the HPC documentation and ensure
each job is compatible with the settings. Note that each job will be run on
every node simultaneously.
Refer to Jobs that require multiple nodes for an example of how to use JADE’s multi-node feature.
Refer to SlurmConfig for a full list of parameters available on NREL’s Eagle HPC with SLURM.
JADE will name each HPC job with this format: <job_prefix>_batch_N where
job_prefix is defined in hpc_config.toml and N is each batch index.
Customize job_prefix if you will be running multiple JADE batches and want
to be able to distinguish them.
Submission Groups
If you need different parameters for different jobs then you can separately define submission groups in the configuration. Refer to Jobs that require different submission parameters for more information.
Lustre Filesystem
If you are running on a Lustre filesystem then you should consider whether to configure the Lustre stripe count. This can be beneficial if the the files you create will be large or if many clients will be accessing them concurrently.
References:
Note
This example Lustre filesystem command will only work if the directory is empty.
$ lfs setstripe -c 16 <run-directory>
Configure Jobs
Create a text file with a list of commands, one per line.
$ cat commands.txt
bash my_script.sh ARG1
bash my_script.sh ARG2
Warning
Commands are not run through a shell, so you cannot use special shell characters. You can workaround this by putting your command in a shell script.
Job Commands
$ jade config create commands.txt -c config.json
Created configuration with 2 jobs.
Dumped configuration to config.json.
JADE created config.json with one definition per job. You can edit this
file to customize execution behavior.
Note
You can assign custom job names. This can make it easier to inspect results.
Refer to GenericCommandParameters for a full list of configurable parameters.
Add blocking jobs
A common use case is to include a post-processing job as the last job, and then make all other jobs blocked by it. Here is one way to do that. This assumes that there are 5 jobs and the last job is the post-processing job.
Note
Job indexes are 0-based.
$ jade config assign-blocked-by config.json 4 -o new-config.json

# These alternatives are identical.
$ jade config assign-blocked-by config.json 4 {0..3} -o new-config.json
$ jade config assign-blocked-by config.json 4 0 1 2 3 -o new-config.json
Tip: Use this command to see the job indexes:
$ jade config show config.json
Create a config programmatically
If you are setting many custom parameters, it may be more convenient to create the JADE configuration programmatically. An example is below. This will make the following customizations:
Make a final post-processing job dependent on the other jobs.
Set a custom name for each job.
from jade.extensions.generic_command import GenericCommandConfiguration, GenericCommandParameters

config = GenericCommandConfiguration()
base_cmd = "bash my_script.sh"
regular_job_names = []
for i in range(1, 4):
    cmd = base_cmd + " " + str(i)
    name = f"job_{i}"
    job = GenericCommandParameters(
        command=cmd,
        name=name,
    )
    config.add_job(job)
    regular_job_names.append(name)

post_process_job = GenericCommandParameters(
    command="bash run_post_process.sh",
    name="post_process",
    blocked_by=regular_job_names,
    cancel_on_blocking_job_failure=True,
)
config.add_job(post_process_job)
config_file = "config.json"
config.dump(config_file, indent=2)
Here is the result:
$ jade config show config.json
Num jobs: 4
+-------+--------------+--------------------------+------------------------+
| index |     name     |         command          | blocked_by (job names) |
+-------+--------------+--------------------------+------------------------+
|   0   |    job_1     |   bash my_script.sh 1    |                        |
|   1   |    job_2     |   bash my_script.sh 2    |                        |
|   2   |    job_3     |   bash my_script.sh 3    |                        |
|   3   | post_process | bash run_post_process.sh |  job_1, job_2, job_3   |
+-------+--------------+--------------------------+------------------------+
Job Ordering
Each job defines a blocked_by field. If you want to guarantee that job ID
2 doesn’t run until job ID 1 completes then add that ID to the field.
If a job that is blocking another job fails then JADE will still run the
blocked job by default. This may not be what you want. You can optionally set
cancel_on_blocking_job_failure to cause those blocked jobs to be canceled.
{
  "command": "<job_cli_command1>",
  "job_id": 1,
  "blocked_by": []
},
{
  "command": "<job_cli_command2>",
  "job_id": 2,
  "blocked_by": [1]
},
{
  "command": "<job_cli_command3>",
  "job_id": 3,
  "blocked_by": [1]
  "cancel_on_blocking_job_failure": false
},
{
  "command": "<job_cli_command4>",
  "job_id": 4,
  "blocked_by": [2, 3],
  "cancel_on_blocking_job_failure": true
}
Show Job Summary
In order to view a summary of your jobs in a table:
$ jade config show config.json

Num jobs: 4
+-------+------+----------------+---------------------------+
| index | name |    command     |   blocked_by (job names)  |
+-------+------+----------------+---------------------------+
|   0   |  1   | julia run.jl 1 |                           |
|   1   |  2   | julia run.jl 2 |            1              |
|   2   |  3   | julia run.jl 3 |            1              |
|   3   |  4   | julia run.jl 4 |           2, 3            |
+-------+------+----------------+---------------------------+
CLI Execution
Jade provides a CLI utility to start jobs.
submit-jobs
Start execution of jobs defined in a configuration file. If executed on HPC this will submit the jobs to the HPC queue. Otherwise, it will run the jobs locally.
It’s important to understand how JADE submits HPC jobs in order to optimize your performance. JADE divides the jobs created by the user into batches. It makes one HPC node submission for each batch. Once running on a node it runs in parallel a number of worker processes equal to the number of CPUs on that node (36 on Eagle).
Parameters to keep in mind:
Number of jobs: Number of jobs created by the user.
Max nodes: Max number of job submissions (batches) to run in parallel. Default is unbounded.
Per-node batch size: Number of jobs to run on one node in one batch.
Allocation time: How long it takes to acquire a node. Dependent on the HPC queue chosen and the priority given.
Average job runtime: How long it takes a job to complete.
HPC config file: Customized HPC parameters like walltime and partition
Time-based batching: If jobs have variable runtimes then it is better to define those runtimes in the config file and then use the
--time-based-batchingflag to let JADE create variable-sized batches. Mutually exclusive with –per-node-batch-size.
If the jobs have a short duration and it takes a long time to acquire a node then you may want to maximize the value of per_node_batch_size. Conversely, if the time to acquire a node is short then you can lower per_node_batch_size in order to run on more nodes in parallel.
Refer to Job Submission Strategies for a description of how to handle specific use cases.
Note that you can set different parameters for different batches if you define submission groups. Refer to Jobs that require different submission parameters for more information.
Note
You can enable --dry-run to check how the batches will be created
without actually submitting any jobs.
Examples:
# Use defaults.
$ jade submit-jobs config.json

# Specify options.
$ jade submit-jobs config.json \
    --output=output \
    --per-node-batch-size=500 \
    --hpc-config=hpc_config.toml
Run jade submit-jobs --help to see all command options and defaults.
To aid with repeated runs you can pass these parameters in a config file. Generate the defaults with
$ jade config submitter-params

Created submitter parameter file submitter_params.toml
And then pass this file to submit-jobs
$ jade submit-jobs config.json -s submitter_params.toml
Note
By default HPC nodes are requested at normal priority. Set qos=high in hpc_config.toml to get faster allocations at twice the cost.
Output Directory
JADE stores all of its configuration information and log files in the output
directory specified by the submit-jobs command. JADE makes this directory
available to jobs in the environment variable JADE_RUNTIME_OUTPUT. JADE
also makes each job name available in the environment variable
JADE_JOB_NAME.
Note
Job names are either job_id cast as a string or the optional name field in config.json.
This enables you to collect all job output files in a common location. JADE
automatically creates <output-dir>/job-outputs for this purpose.
Your job can store its output files in <output-dir>/job-outputs/<job-name>
Suppose your actual job command accepts a parameter for an output directory like this:
run_my_simulation -o my-output-folder --arg1 X --arg2 Y
Here is an example JADE wrapper script that forwards the runtime directory to your program. It will also forward the rest of the arguments.
#!/bin/bash run_my_simulation -o $JADE_RUNTIME_OUTPUT/job-outputs/$JADE_JOB_NAME $@
The command given to JADE would be bash jade_wrapper.sh --arg1 X --arg2 Y.
Setup and teardown scripts
JADE supports the ability to run a setup script before running any jobs as well as a teardown
script after all jobs finish. Define the parameters setup_command and teardown_command
in config.json.
JADE will run the setup_command on the node where you run jade submit-jobs, so be
careful if this task will consume lots of computing resources. You may want to submit from
a debug node instead of a login node.
JADE will run the teardown_command on the last node to finish its jobs. It will run the
command regardless of whether jobs pass or fail. Be sure to account for impacts to the
per-node walltime timeout.
The following environment variable is available when these scripts are executed:
JADE_RUNTIME_OUTPUT: output directory passed tojade submit-jobs
Note
In jade resubmit-jobs Jade will not rerun the setup command. It will re-run the teardown command.
Note that the output directory contains a copy of config.json in case you need to access
information from it.
When running on an HPC you might want to copy input files to each compute node
before running jobs and then upload output data afterwards. Define the parameters
node_setup_command and node_teardown_command in config.json. JADE will run those
commands before and after running each node’s batch of jobs.
Note that the following environment variables are available when these scripts are executed:
JADE_RUNTIME_OUTPUT: This is the output directory passed tojade submit-jobsJADE_SUBMISSION_GROUP: This is the name of the submission group for the node.
Note
You can also set these parameters programmatically when constructing GenericCommandConfiguration.
Example configurations
Check out https://github.com/NREL/jade/tree/main/examples for examples using features discussed above.
Job Execution
HPC
The job submitter runs in a distributed fashion across the login node and all compute nodes that get allocated.
User initiates execution by running
jade submit-jobson the login node.JADE submits as many batches as possible and then exits. Jobs can be blocked by ordering requirements or the user-specified max-node limit.
HPC queueing system allocates a compute node for a batch of jobs and starts the JADE job runner process.
Both before and after running a batch of jobs the job runner will run
jade try-submit-jobs. If it finds newly-unblocked jobs then it will submit them in a new batch. This will occur on every allocated compute node.When a submitter detects that all jobs are complete it will summarize results and mark the configuration as complete.
The JADE processes synchronize their activity with status files and a file lock in the output directory.
Refer to Distributed Submission Workflow for a diagram of this process.
Local
JADE runs all jobs at the specified queue depth until they all complete.
Job Status
While jobs are running you can check status with this command:
$ jade show-status -o output
The status is updated when each compute node starts or completes its execution of a batch, so this status may not be current.
Each job runner will log a message when it starts a job. Run this command to follow all job starts:
$ tail -f $(ls output/run_jobs_batch_*.log | grep -v events) | grep "Started job"
Each job runner will log completions to its own file, so you can see live job completions with this command. Note that these files are cleared each time a submitter processes them.
$ tail -F output/results/results_batch_1.csv
# This will follow all files that exist, not ones yet to be created.
$ tail -F output/results/results_batch_*.csv
Check processed jobs in this file:
# Find out how many have completed.
$ wc -l output/processed_results.csv

# Follow updates.
$ tail -f output/processed_results.csv
Every submitter will log to the same file, so you can monitor submission status with this command:
$ tail -f output/submit-jobs.log
You can also trigger a full status update by manually trying to submit new jobs.
$ jade try-submit-jobs output
$ jade show-status -o output
Canceling Jobs
You can cancel all jobs running in a submission with this command:
$ jade cancel-jobs output
Job Results
Once execution is complete you can view the results of the jobs.
$ jade show-results --output=output
Or only the ones that failed
$ jade show-results --failed
JADE stores all results in a SQLite database. You can also use it to view results. Please refer to Results Queries for examples.
Failed or Missing Jobs
If some jobs fail because of a walltime timeout or code/data error then you can resubmit those specific jobs without re-running all the jobs that passed.
Jobs that timeout will be reported as missing.
Note
You can resubmit with different submission parameters, such as walltime,
if you run jade config save-submission-groups output,
edit the resulting file, and then pass it to jade resubmit-jobs with -s <file>
$ jade resubmit-jobs --missing --failed output
Note
This command is currently not supported in local mode.
HPC Job information
Hours Used
Run this command after your jobs finish to see how many node hours you used. Note that you can pass multiple output directories to accumulate jobs.
$ jade hpc-jobs show-times output-dir*

+------------+---------------------+---------------------+---------------------+----------+------------+-----------+--------+
| hpc_job_id |         name        |        start        |         end         |  state   |  account   | partition |  qos   |
+------------+---------------------+---------------------+---------------------+----------+------------+-----------+--------+
|  9040969   |   P11U_CBA_batch_1  | 2022-04-15 18:58:17 | 2022-04-15 19:01:32 | complete | distcosts3 |   short   | normal |
|  9040970   |   P11U_CBA_batch_2  | 2022-04-15 18:58:17 | 2022-04-15 19:02:04 | complete | distcosts3 |   short   | normal |
|  9040971   |   P11U_CBA_batch_3  | 2022-04-15 18:58:17 | 2022-04-15 19:02:39 | complete | distcosts3 |   short   | normal |
|  9040972   |   P11U_CBA_batch_4  | 2022-04-15 18:58:17 | 2022-04-15 19:01:17 | complete | distcosts3 |   short   | normal |
|  9040973   |   P11U_CBA_batch_5  | 2022-04-15 18:58:17 | 2022-04-15 19:01:22 | complete | distcosts3 |   short   | normal |
|  9041184   | P11U_CBA_pp_batch_1 | 2022-04-15 19:10:26 | 2022-04-15 19:15:13 | complete | distcosts3 |   short   | normal |
+------------+---------------------+---------------------+---------------------+----------+------------+-----------+--------+

Total duration = 1 day, 2:25:13
Total hours = 26.42
Total AUs = 79.26
Active Job IDs
You may want to run HPC-specific commands on job IDs to perform some action not directly supported by JADE. You can run this command to see the active HPC job IDs (pending or running).
$ jade hpc-jobs list-active-ids <output-dir>
Suppose you want to change the walltime value for each pending job. This example will work if your HPC uses SLURM. (This will only work on pending jobs.)
$ for x in `jade hpc-jobs list-active-ids <output-dir>`; do scontrol update jobid=$x TimeLimit="24:00:00"; done
Debugging
By default JADE generates report files that summarize what happened. Refer to
results.txt, errors.txt, stats.txt, and stats_summary.json.
The results file shows whether each job passed or failed. The errors file
shows unhandled errors that JADE detected as well as known errors that it
parsed from log files.
Here are the log files that JADE generates. Open these to dig deeper.
submit_jobs.log: HPC-related information, such as the job ID and statusrun_jobs.log: information about JADE starting and stopping jobsjob-stdio: Jade logs stdout and stderr from each job to this directory.job_output_<HPC job ID>.e: The HPC logs stdout and stderr to this file. You will see output for HPC software and the operating system. Look here to debug unexpected crashes or hangs.
$ find output -name "*.log" -o -name "*.e"
output/J1__3__1.15__1.0__deployment1.dss/logs/deployment1.dss_simulation.log
output/J1__3__1.15__1.0__deployment1.dss/pydss-project/Logs/pydss-project_deployment1.dss.log
output/submit_jobs.log
output/job_output_1151157.e
Python crashes will print Traceback to stderr, so that is a good string
to search for.
SLURM error strings: srun, slurmstepd, DUE TO TIME LIMIT
Useful grep commands
# find error keywords in log and stderr files
$ grep "WARNING\|ERROR" output/*log
$ grep -n "srun\|slurmstepd\|Traceback" output/*.e

# From the stats_summary, check max memory usage (in %) per node, in the form of sorted values.
# This could inform the num_parallel_processes_per_node setting.
$ grep "\bpercent\b" output/stats_summary.json | awk '{print $2}' | sort -n
Matching JADE jobs with HPC logs
As mentioned above the HPC system captures stderr and stdout in <output-dir>/job_output_<HPC job ID>.e
and <output-dir>/job_output_<HPC job ID>.o. You may need to match JADE job IDs/names with these
files.
To help with this JADE records the HPC job ID for each job in results.txt (or jade show-results).
You can also refer to Results Queries. The result table includes this information.
Events
If your extension implements JADE structured log events then you may want to view what events were logged.
JADE will also log any unhandled exceptions here.
$ jade show-events
$ jade show-events -c Error
Filtering jobs
You may want to debug a subset of the jobs.
Filter the first job into a new config file:
$ jade config filter config.json 0 -o new_config.json
Filter ranges of indices of jobs into a new config file:
$ jade config filter config.json {0..4} {10:14} 20 25 -o new_config.json
Deadlocks
While it should be very rare, it is possible that JADE gets deadlocked and stops submitting jobs. When a compute node finishes a batch of jobs it acquires a file lock in order to update status and attempt to submit new jobs. This should usually take at most a few seconds. If a walltime timeout occurs while this lock is held and the JADE process is terminated then no other node will be able to promote itself to submitter and jobs will be stuck.
We plan to add code to detect this condition in the future. If this occurs you can fix it manually by deleting the lock file and restarting jobs. This is safe if you know that no new jobs were submitted. It is unsafe if one or more jobs were submitted but not recorded. Restarting the jobs could result in the same jobs being run multiple times.
$ rm <output-dir>/cluster_config.json.lock
$ jade try-submit-jobs <output-dir>
If you would like to avoid the possibility of this happening then you can
pass --no-distributed-submitter to jade submit-jobs. That will prevent
each compute node from updating status or looking for unblocked jobs to submit.
You will need to run the command jade try-submit-jobs yourself to do this.
If you enable periodic resource utilization collection in this mode, be aware
of the fact that once JADE detects that all jobs are complete it will
aggregate the stats and generate plots in that process. This is
resource-intensive and you may not want to run jade try-submit-jobs on the
login node.
Resource Monitoring
In order to maximize the compute hours you consume it is critical to understand the performance characteristics of your jobs. JADE helps with resorce monitoring tools that run in the background on each node.
Note
Your HPC may already provide this type of information. If it makes the data easily accessible, you may want to disable all JADE monitoring.
Available monitors
CPU utilization for each node (default = enabled)
Memory utilization for each node (default = enabled)
Process utilization by job (default = disabled)
CPU and memory utilization
Include child processes (default = enabled)
Search for child processes recursively (default = disabled)
Local disk utilization (default = disabled: Does not include Lustre filesystem.
Network utilization (default = disabled)
Collection modes
aggregation: Track average/min/max stats in memory on each node and generate a summary report at the end (default). Does not store data in files.periodic: Record stats in files on each node and generate a summary report and interactive HTML plots at the end. The reports include average/min/max stats. File sizes can be large with long runtimes.
Examples
Monitoring is highly configurable. Due to the number of options, it is
recommended to create a submitter_params.json file and edit the settings
there.
You can specify most options in either jade submit-jobs or jade config
submitter-params.
Collect aggregated stats for CPU, memory, and per-job processes (including direct child processes)
$ jade config submitter-params -R aggregation -m cpu -m mem -m process
Collect stats for CPU, memory, and per-job processes every 5 seconds
$ jade config submitter-params -R periodic -r 5 -m cpu -m mem -m process
Collect per-job process information only for your job processes.
This is more efficient than scanning for child processes. However, if your job is a bash script that starts another process to do the real work, that work won’t be monitored.
$ jade config submitter-params -R periodic -r 5 -m process

# Edit the newly-created submitter_params.json such that include_child_processes=false
Collect per-job process information for all processes started by your jobs, recursively.
$ jade config submitter-params -R periodic -r 5 -m process

# Edit the newly-created submitter_params.json such that include_child_processes=true
# and recurse_child_processes=true
Disable all monitoring
$ jade config submitter-params -R none
Output files
Both collection modes will generate <output-dir>/stats.txt and
<output-dir>/stats_summary.json.
If the periodic mode is enabled:
$ tree output/stats
output/stats
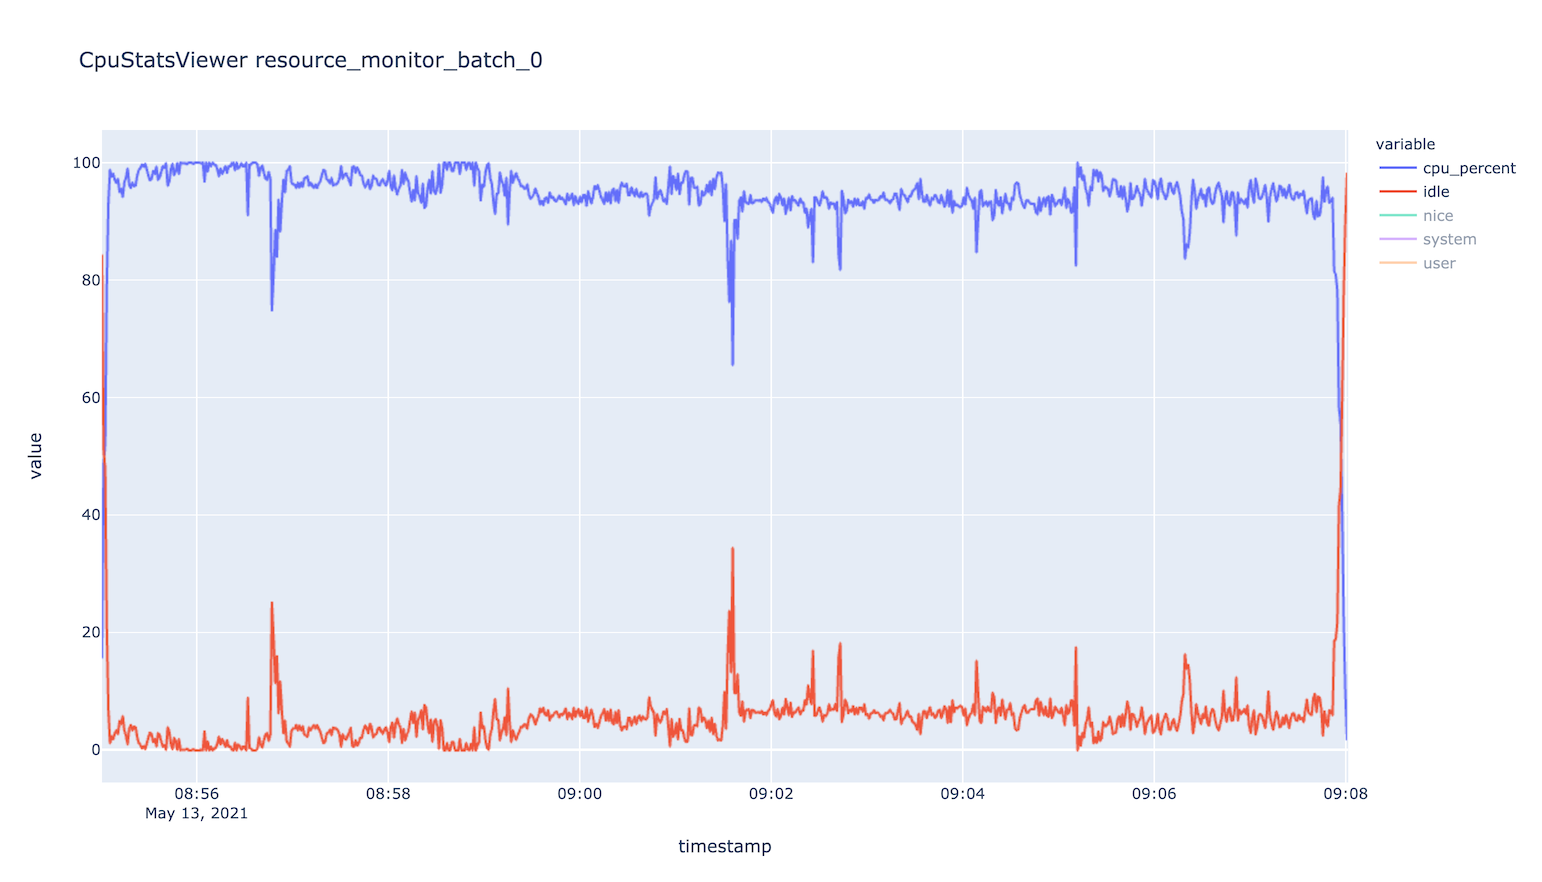
├── CpuStatsViewer__resource_monitor_batch_0.html
├── ProcessStatsViewer__cpu_percent.html
├── ProcessStatsViewer__rss_percent.html
├── DiskStatsViewer__resource_monitor_batch_0.html
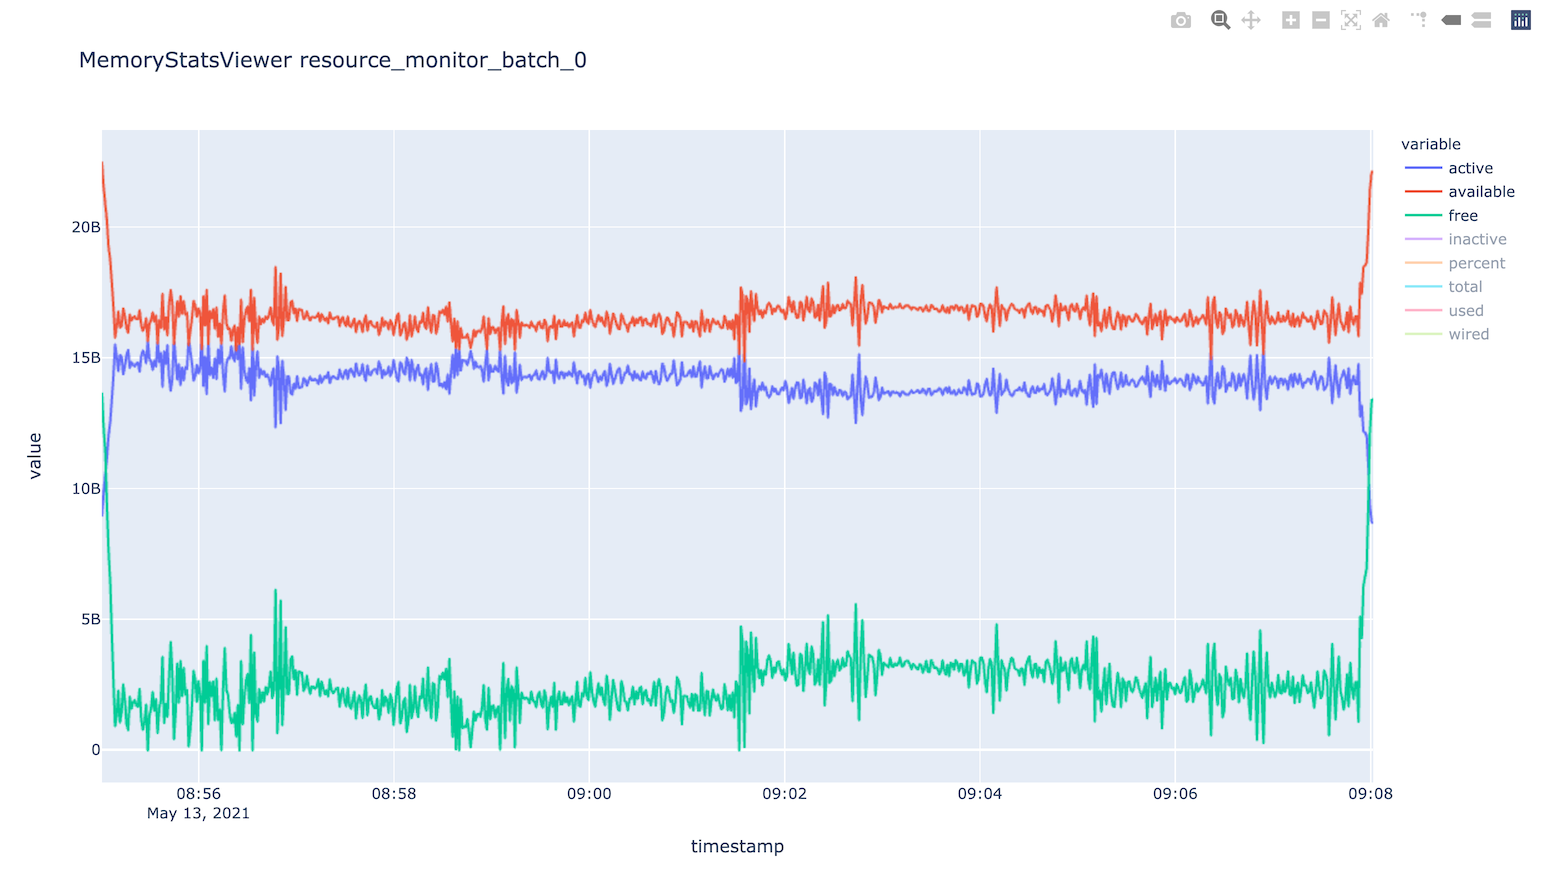
├── MemoryStatsViewer__resource_monitor_batch_0.html
└── NetworkStatsViewer__resource_monitor_batch_0.html
Use this CLI command to view textual tables after a run:
$ jade stats show
$ jade stats show cpu
$ jade stats show mem
$ jade stats show proc
$ jade stats show --summary-only
$ jade stats show --json-summary
Use the --json-summary option if you want to programmatically analyze the
average/minimum/maximum stats for each metric type.
The stats can also be provided as pandas.DataFrame objects. For example, here is how to view CPU stats for the node that ran the first batch:
from jade.events import EventsSummary, EVENT_NAME_CPU_STATS
from jade.resource_monitor import CpuStatsViewer

summary = EventsSummary("output")
viewer = CpuStatsViewer(summary)
for name in viewer.iter_batch_names():
    cpu_df = viewer.get_dataframe(name)
    print(cpu_df.head())
The directory <output-dir>/events contains Parquet files for each stat. You can
also open these directly. Note that the source column designates the node/batch
that generated each row. For process dataframes, the job name is in the
name column, and you should use it.
import pandas as pd

# Print max memory usage in GiB by each job.
df = pd.read_parquet("output/events/process_stats.parquet")
for name, dfp in df.groupby(by="name"):
    print(name, dfp.rss.max() / (1024 * 1024 * 1024))
Standalone Resource Monitoring
The same resource monitoring functionality is available as a standalone script. This can be useful to debug your application on your own system or in an interactive session on a compute node. Here’s how to do it:
$ jade stats collect --interval=1 --output=job-stats
# Run your application in a separate terminal.
# Press Ctrl-c when your application is finished.
$ jade stats plot --output=job-stats
2021-05-12 16:59:48,367 - INFO [jade.resource_monitor resource_monitor.py:226] : Generated plot in job-stats/stats/CpuStatsViewer__ResourceMonitor.html
2021-05-12 16:59:48,462 - INFO [jade.resource_monitor resource_monitor.py:226] : Generated plot in job-stats/stats/DiskStatsViewer__ResourceMonitor.html
2021-05-12 16:59:48,541 - INFO [jade.resource_monitor resource_monitor.py:226] : Generated plot in job-stats/stats/MemoryStatsViewer__ResourceMonitor.html
2021-05-12 16:59:48,629 - INFO [jade.resource_monitor resource_monitor.py:226] : Generated plot in job-stats/stats/NetworkStatsViewer__ResourceMonitor.html
Open the interactive plots in a browser.
You can also use the standalone tool to monitor currently running processes
by process ID or name. Refer to jade stats collect --help for more information.