Overview and Methodology#
The buildstock-projections library calculates future building counts and tenure status (occupied/vacant) while also providing a mechanism for users to define code adoption and existing building technology adoption. This is accomplished through the modules described below. There are four steps that get repeated with each timestep in which operations are performed on the previous year’s buildstock. Modules are applied sequentially as:
Population Projections (prior to first timestep)
Demolition (at each timestep)
Vacancy (at each timestep)
New Construction (at each timestep)
Building Options (at each timestep)
New construction options
Existing building options
Results Vizualization (after final timestep)
Population Projections 🔗#
The population module imports population projection inputs and applies a regression to infer missing data. This module runs prior to iterating through projection years and the outputs inform other modules. Inputs for the population module include baseline population data by PUMA, and population data for at least one future year. A 2nd order polynomial regression is applied to the input data to infer PUMA populations for timesteps in which there is no data. An example for one PUMA is shown below, where the population inputs are provided for 2020, 2030, and 2050.
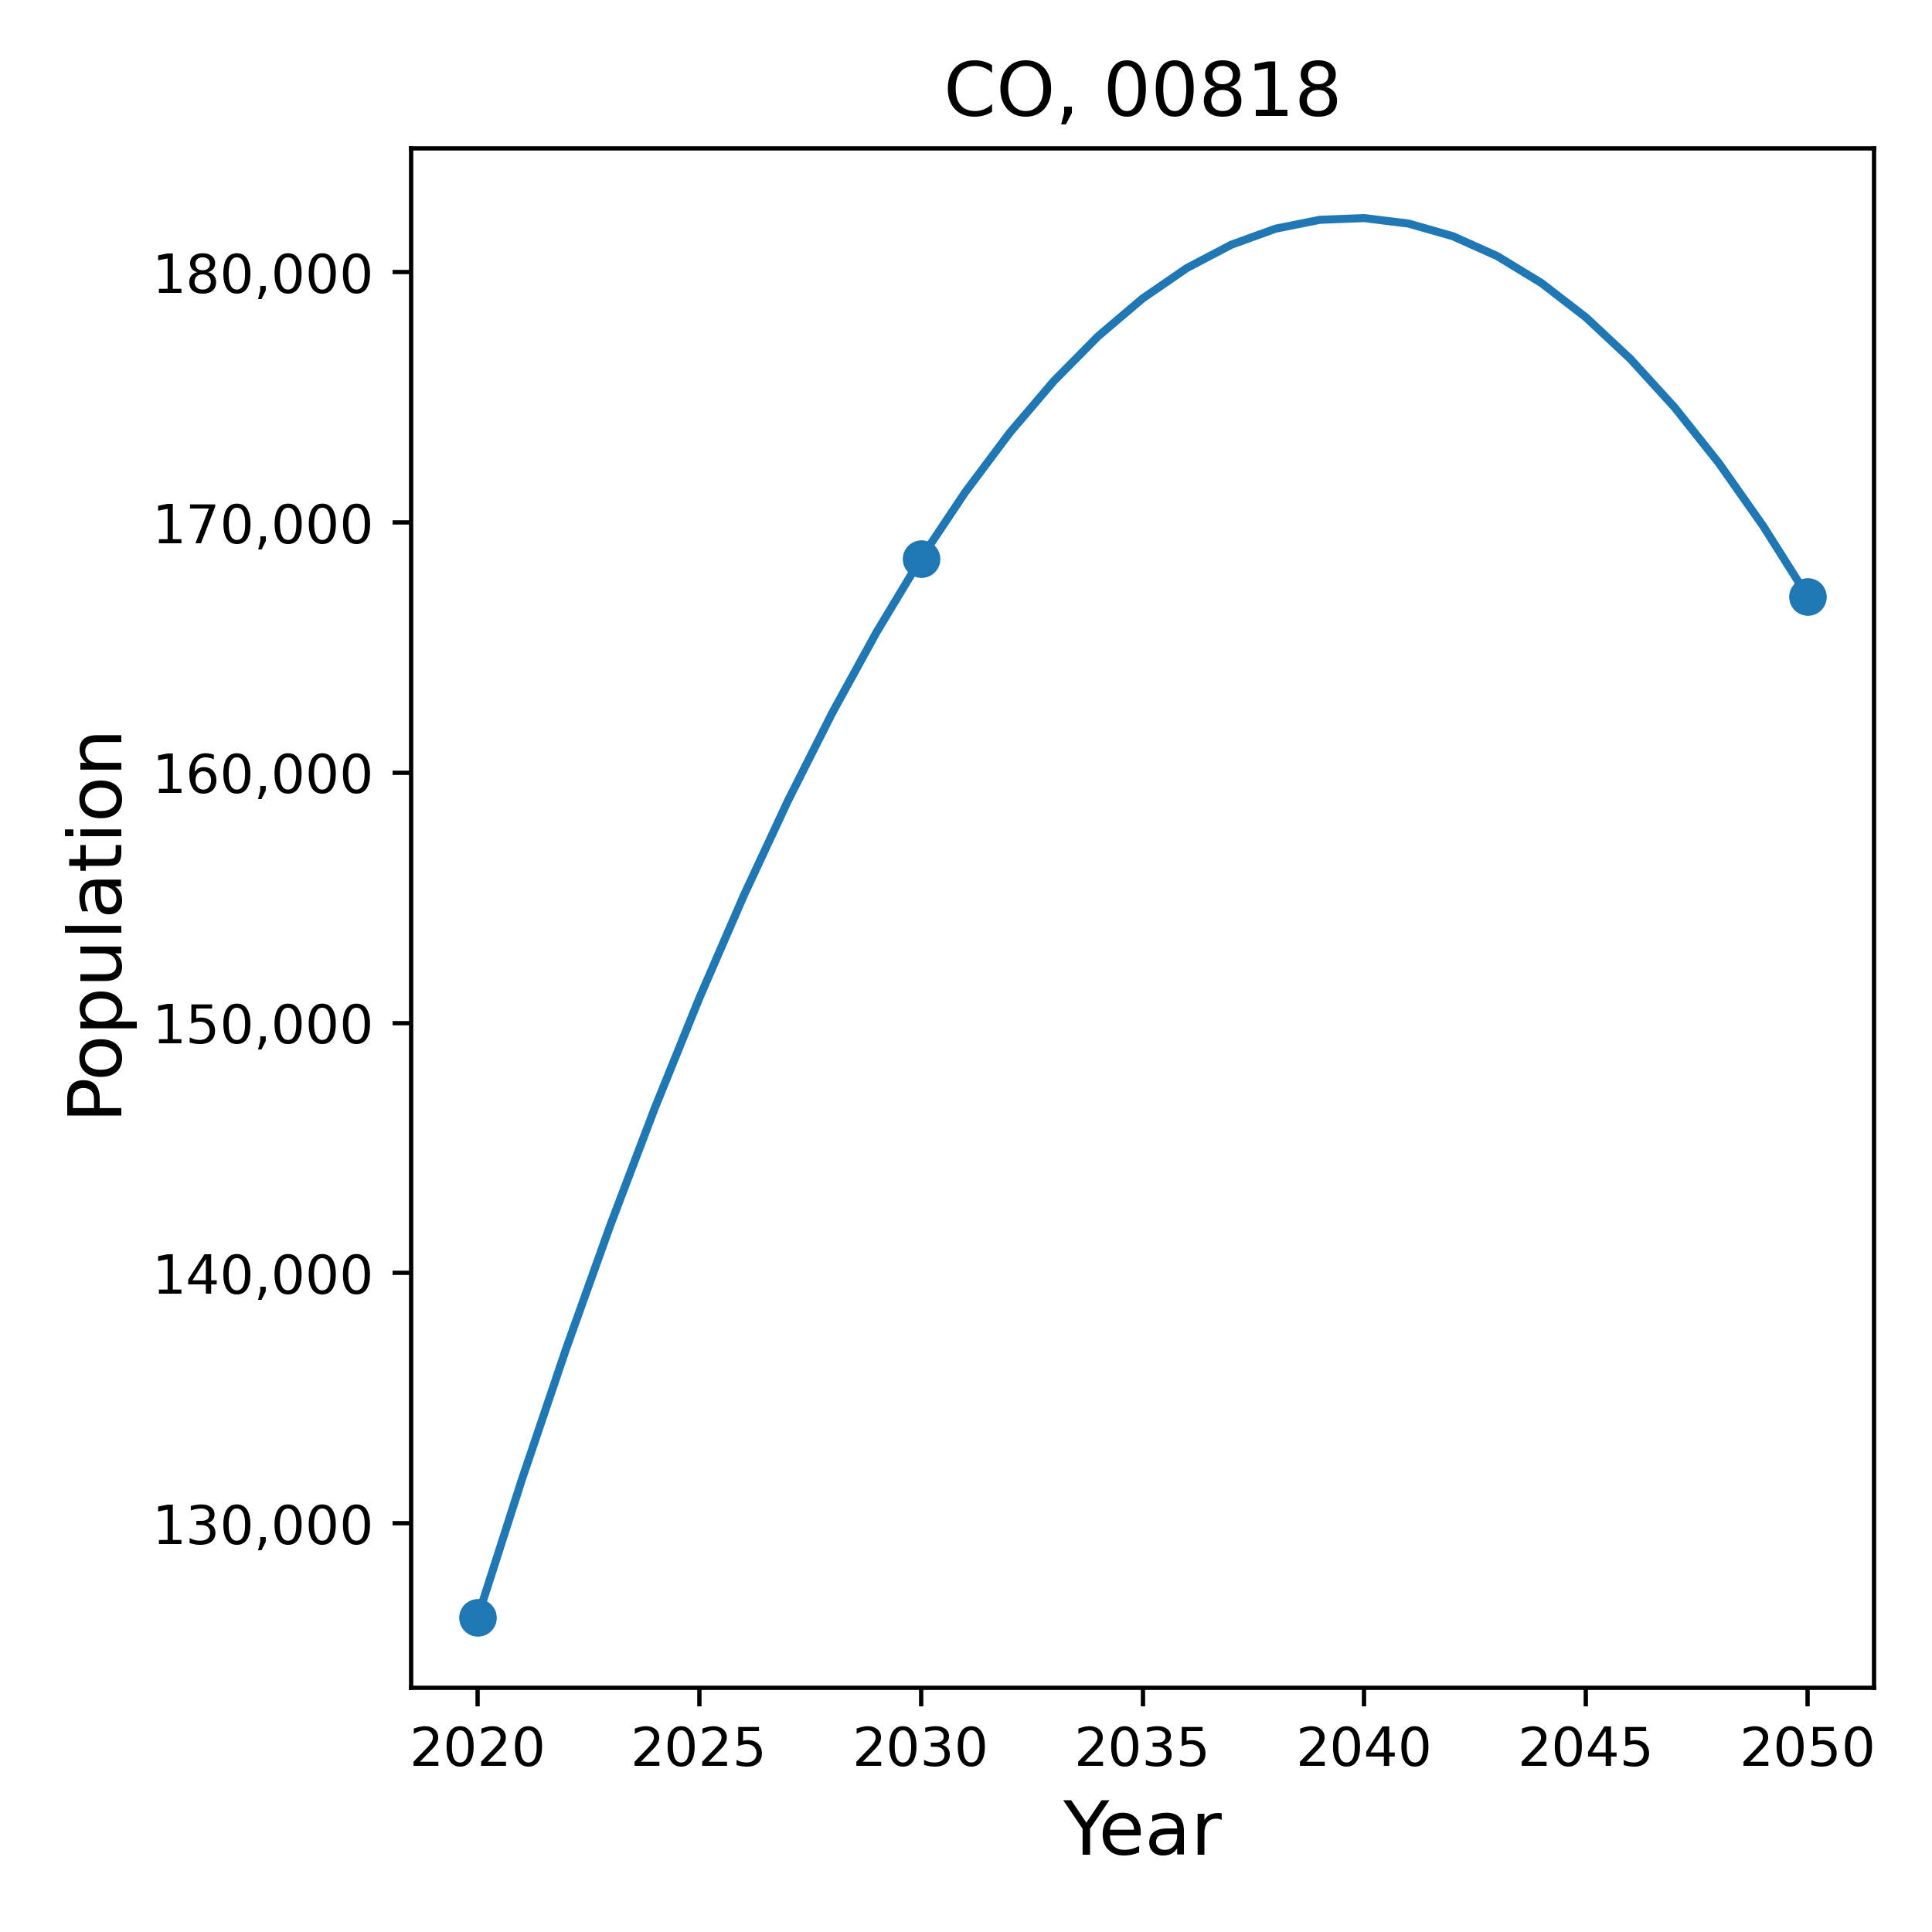
Fig. 1 Demonstration of the population regression for a single PUMA. Known datapoints include 2020, 2030, and 2050.#
Documentation regarding input files for population can be found here
Demolition 🔗#
The demolition module calculates expected demolition and updates the building stock to represent demolition for each PUMA and year. The current demolition model is only implemented for ResStock and assumes flat demolition rates by building vintage with a random scaling factor. To apply rates, the total count of residential buildings by PUMA and Age Bin is calculated and reduced by the specific rate for the PUMA and age bin combination, as shown in the example below. This new count is then proportionately distributed to the building rows based on their PUMA and Age Bin.
PUMA |
Age Bin |
Demolition Rate |
Initial Count |
New Count |
|---|---|---|---|---|
AL, 00100 |
(0, 9) |
0.001 |
8,744 |
8,735.26 |
AL, 00100 |
(10, 19) |
0.0014 |
9,200 |
9,187.12 |
… |
… |
… |
… |
… |
WY, 00500 |
100+ |
0.0021 |
7,500 |
7,484.25 |
This is a simplified approach to modeling demolition; future work will include implementing demolition projections for commercial buildings and building a more advanced model for projection residential demolition.
Vacancy 🔗#
Vacancy is only applicable to residential buildings, and follows a similar approach as demolition. Vacancy rates by PUMA are currently assumed to be the same for each future year run, defaulting to the vacancy rates calculated from the initial buildstock. The application of these rates differs from demolition in that the total count of buildings does not change, instead, just the ratio of occupied to vacant units changes. For a given PUMA, if the desired vacancy rate is higher than the existing, than the weights of occupied units is increased and the weights of vacant units is decreased, the opposite occurs when the desired vacancy rate is less than the existing.
Future work may include implementation of a more advanced vacancy model that introduces other external variables such as population change.
New Construction 🔗#
The new construction module calculates the number of new units or buildings that should be added in a timestep, then samples to generate new buildstock data. Additionally, the building options module is called to update the new construction and existing options, and the vacant units are scaled to ensure that the desired population projection is met. The steps for new construction differ for ResStock and ComStock:
ResStock
Calculate New Construction Required: The population change from the previous year is calculated and divided by the occupant density (people/unit) to get a desired number of new units for each PUMA. Constraints are applied to this operation to set minimum construction rates, maximum construction rates, and bounds on the year to year change in construction rates.
Sample New Construction: The desired number of units is divided by the base sample weight to estimate the number of new rows needed to meet the population. This number is provided to the sampler along with constraints to return only newer vintages.
Correct Vacancy for Population: Because of the constraints applied and the variability in sampled occupant density, the population change is not always met after sampling. This difference is addressed by adjusting the vacancy of the existing building stock in each PUMA - if sampled population is too low, vacant units are scaled down and occupied scaled up, if sampled population is too high, occupied units are scaled down and vacant units are scaled up.
Apply Building Options: Characteristics of the sampled units are updated based on user inputs, as described in the next section.
ComStock
Calculate New Construction Required: The population change from the previous year is calculated and divided by the floor area density (people/ft\(^2\)) to get a desired number of new buildings for each PUMA and building type. This assumes that the initial year density is desired in future years, and new buildings are only added to meet the change in population.
Sample New Construction: Constraints limiting the PUMA, building type, and floor area are applied to the building stock and one building is sampled for each unique combination of those inputs. If no building exists, the floor area constraint is relaxed to allow for any size building to be sampled.
Apply Building Options: Characteristics of the sampled buildings are updated based on user inputs, as described in the next section.
Building Options Specification (New Construction & Existing)🔗#
In each projection year, users can define a set of options that are applied to new construction and options applied to the existing set of buildings. Options applied to new construction can often be thought of as future energy code and equipment standards, while options applied to the existing stock may represent technology turnover or energy efficiency and equipment upgrades. Both the new and existing scenarios use the same format for inputs, and may be applied to subsets of the stock by using an adoption rate or housing characteristic filters, as further described in the Future Building Options section.
Results Visualization and Outputs 🔗#
Output files are either automatically generated or specified during project configuration, and visualizations are run as a post-processing step to help users understand the projection results. More information on these outputs and how to generate them can be found in the Outputs and Vizualizations section.
Limitations#
There exists limitations in the current model to be addressed in the future:
No demolition model implemented for ComStock
Only a simple demolition model for ResStock
Only a simple vacancy model for ResStock
ResStock sampling: the ResStock sampler can be called, however both PUMA and vintage cannot be applied to constrain the sampler, and therefore only PUMA is downselected and any vintage may be sampled (instead of just new buildings)
ComStock sampling: the ComStock sampler cannot be called, and therefore sampling is performed only with the existing building stock
Technology turnover can be modeled using an adoption rate, but cannot depend on existing age of technologies
Final buildstock outputs may have inconsistencies between options. Because users can independently update options to the buildstock, existing options may not be updated to ensure compatibility, which could potentially introduce breaking changes.